Ulley Village Survey
Main findings
Local Area
-
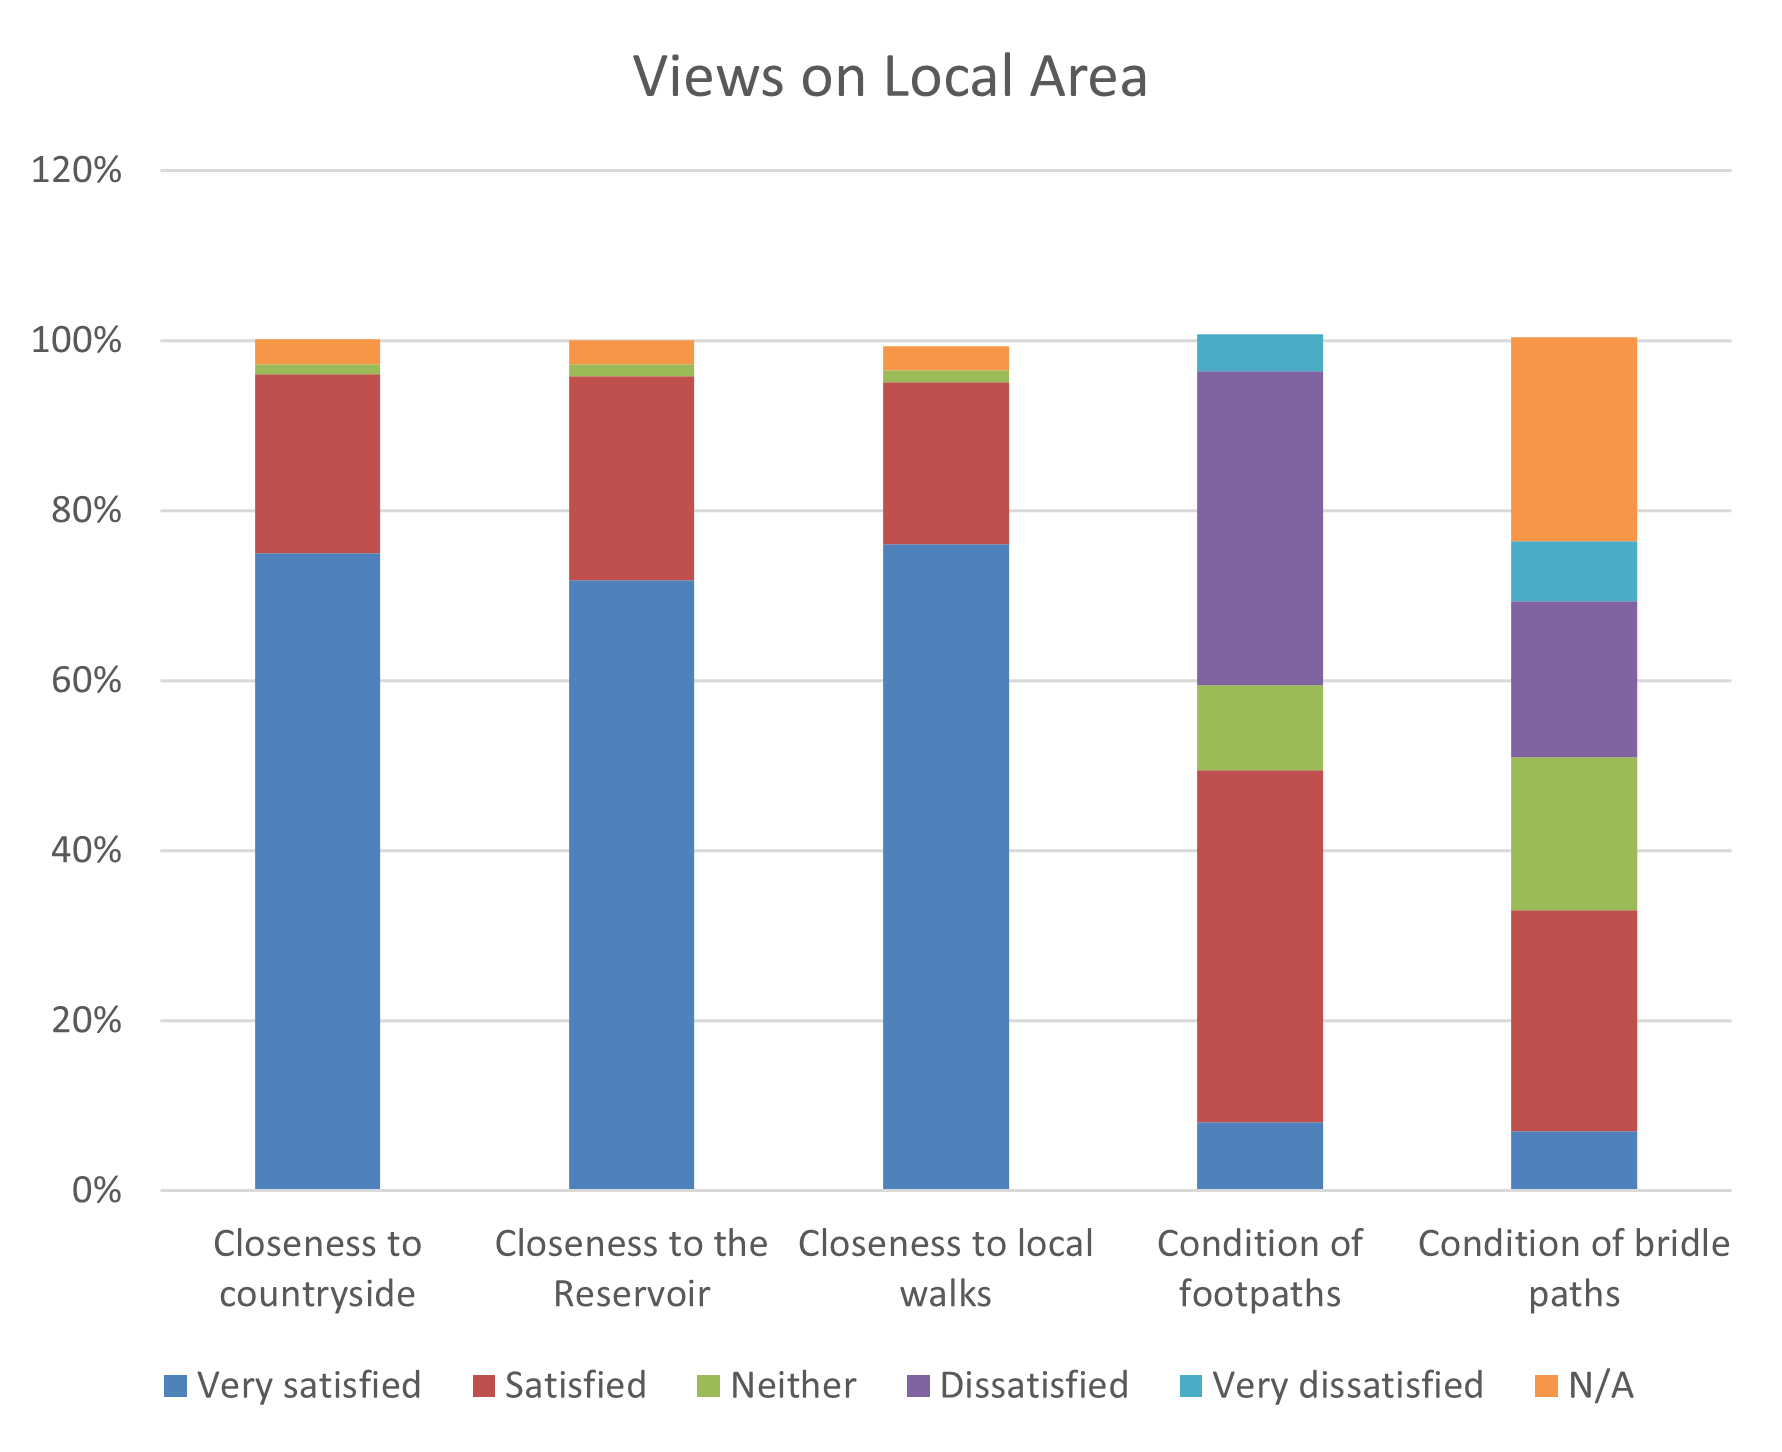
Respondents were very positive about the local area, especially proximity to countryside, reservoir and local walks. The majority rated these elements of village life as very satisfactory.
-
However, felt to be less satisfactory was the state of local footpaths with 41% dissatisfied or very dissatisfied.
-
Of those with an opinion, almost a third (32%*) were dissatisfied with the state of bridleways.
Amenities
-
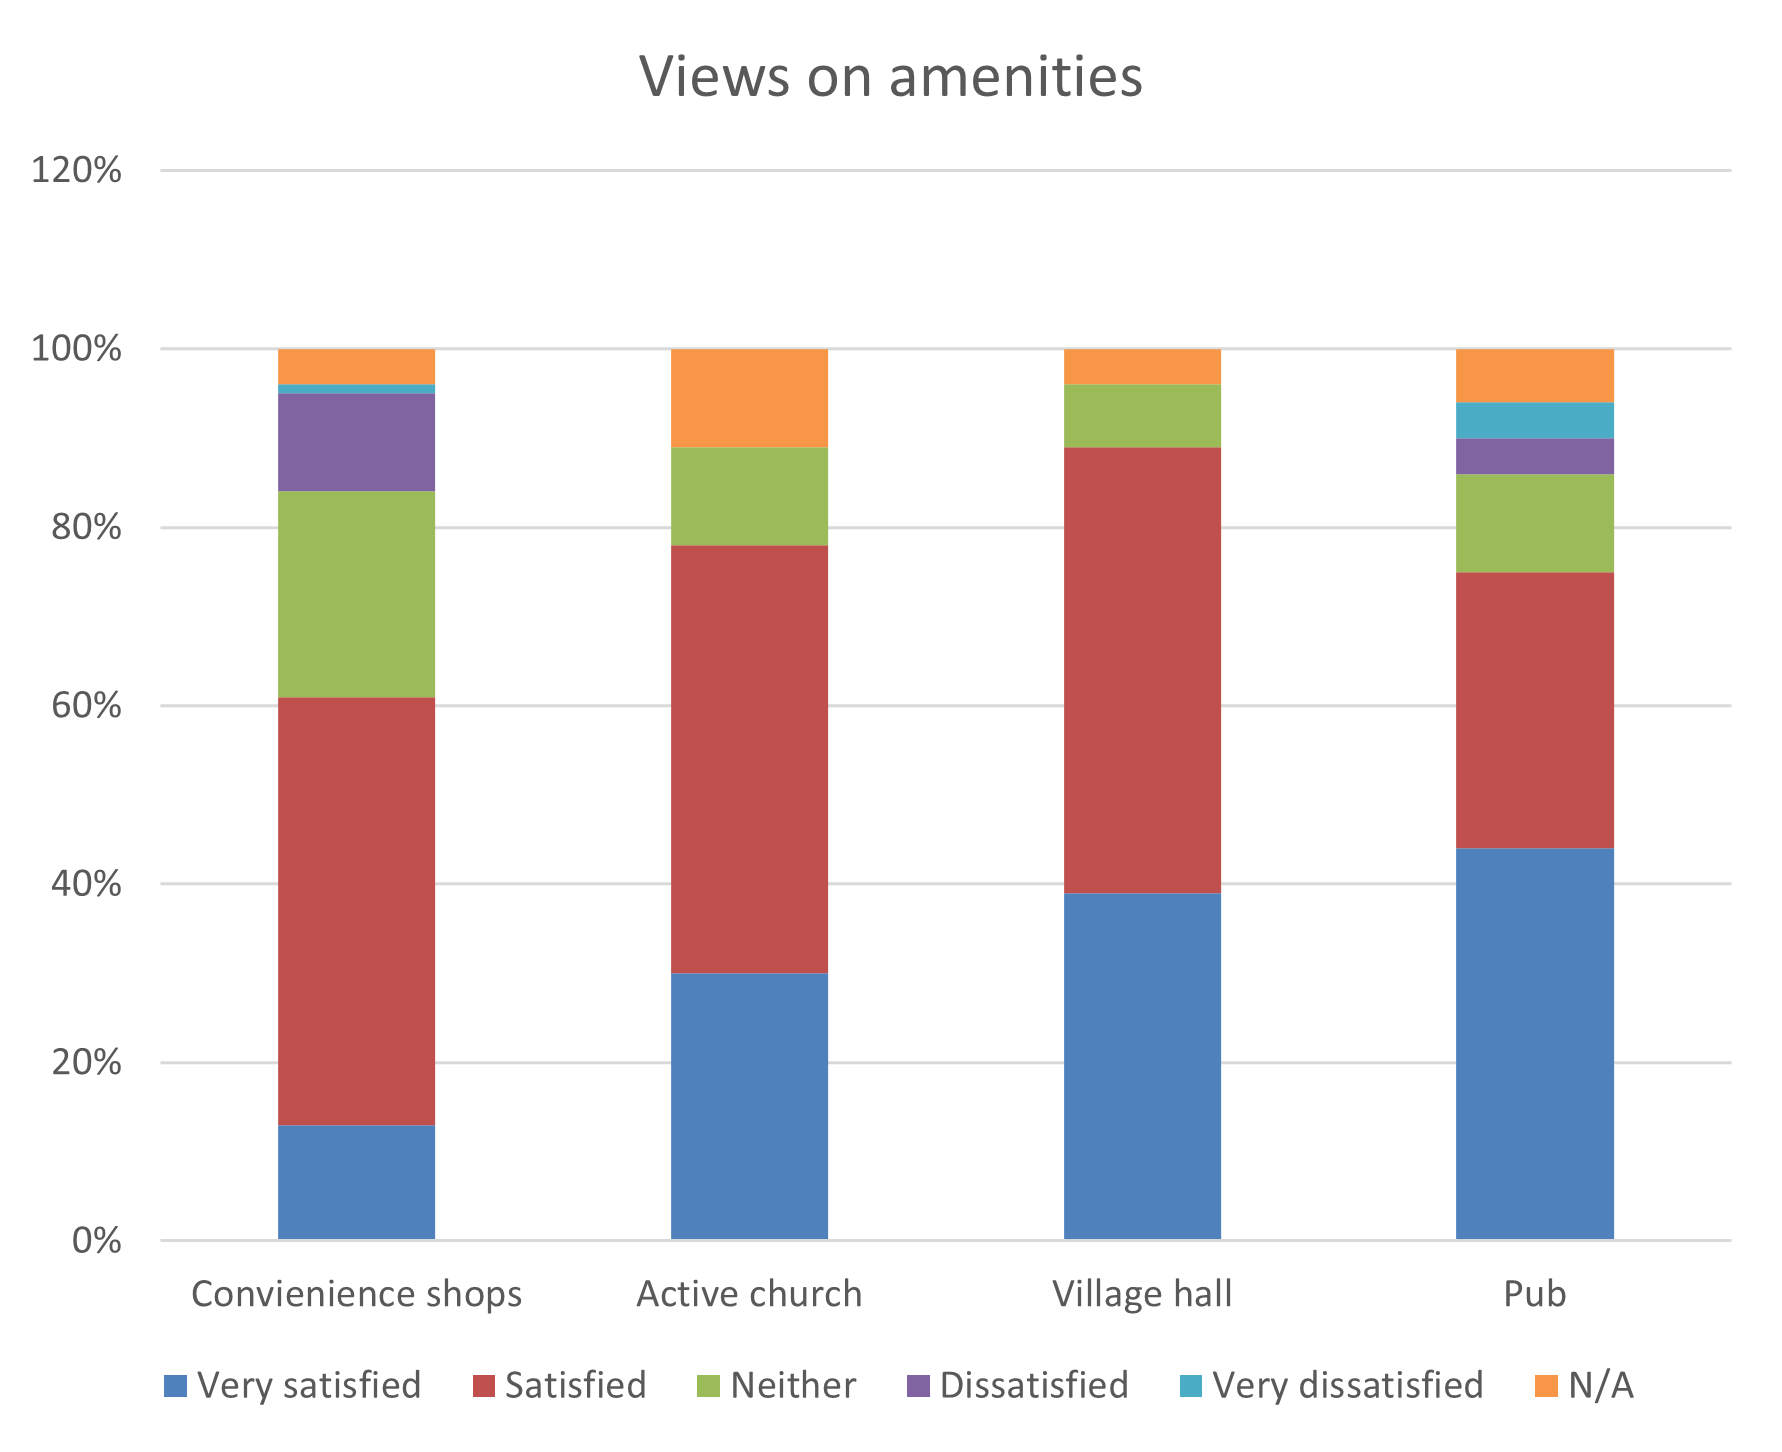
Respondents are most satisfied with:
-
having a village hall (+ve 89%)
-
having a village hall (+ve 89%)
-
and having a pub (when it’s open!) (+ve 75%)
-
Respondents are generally satisfied with the convenience for local shopping centres but with some apathy or dissatisfaction expressed.
Community
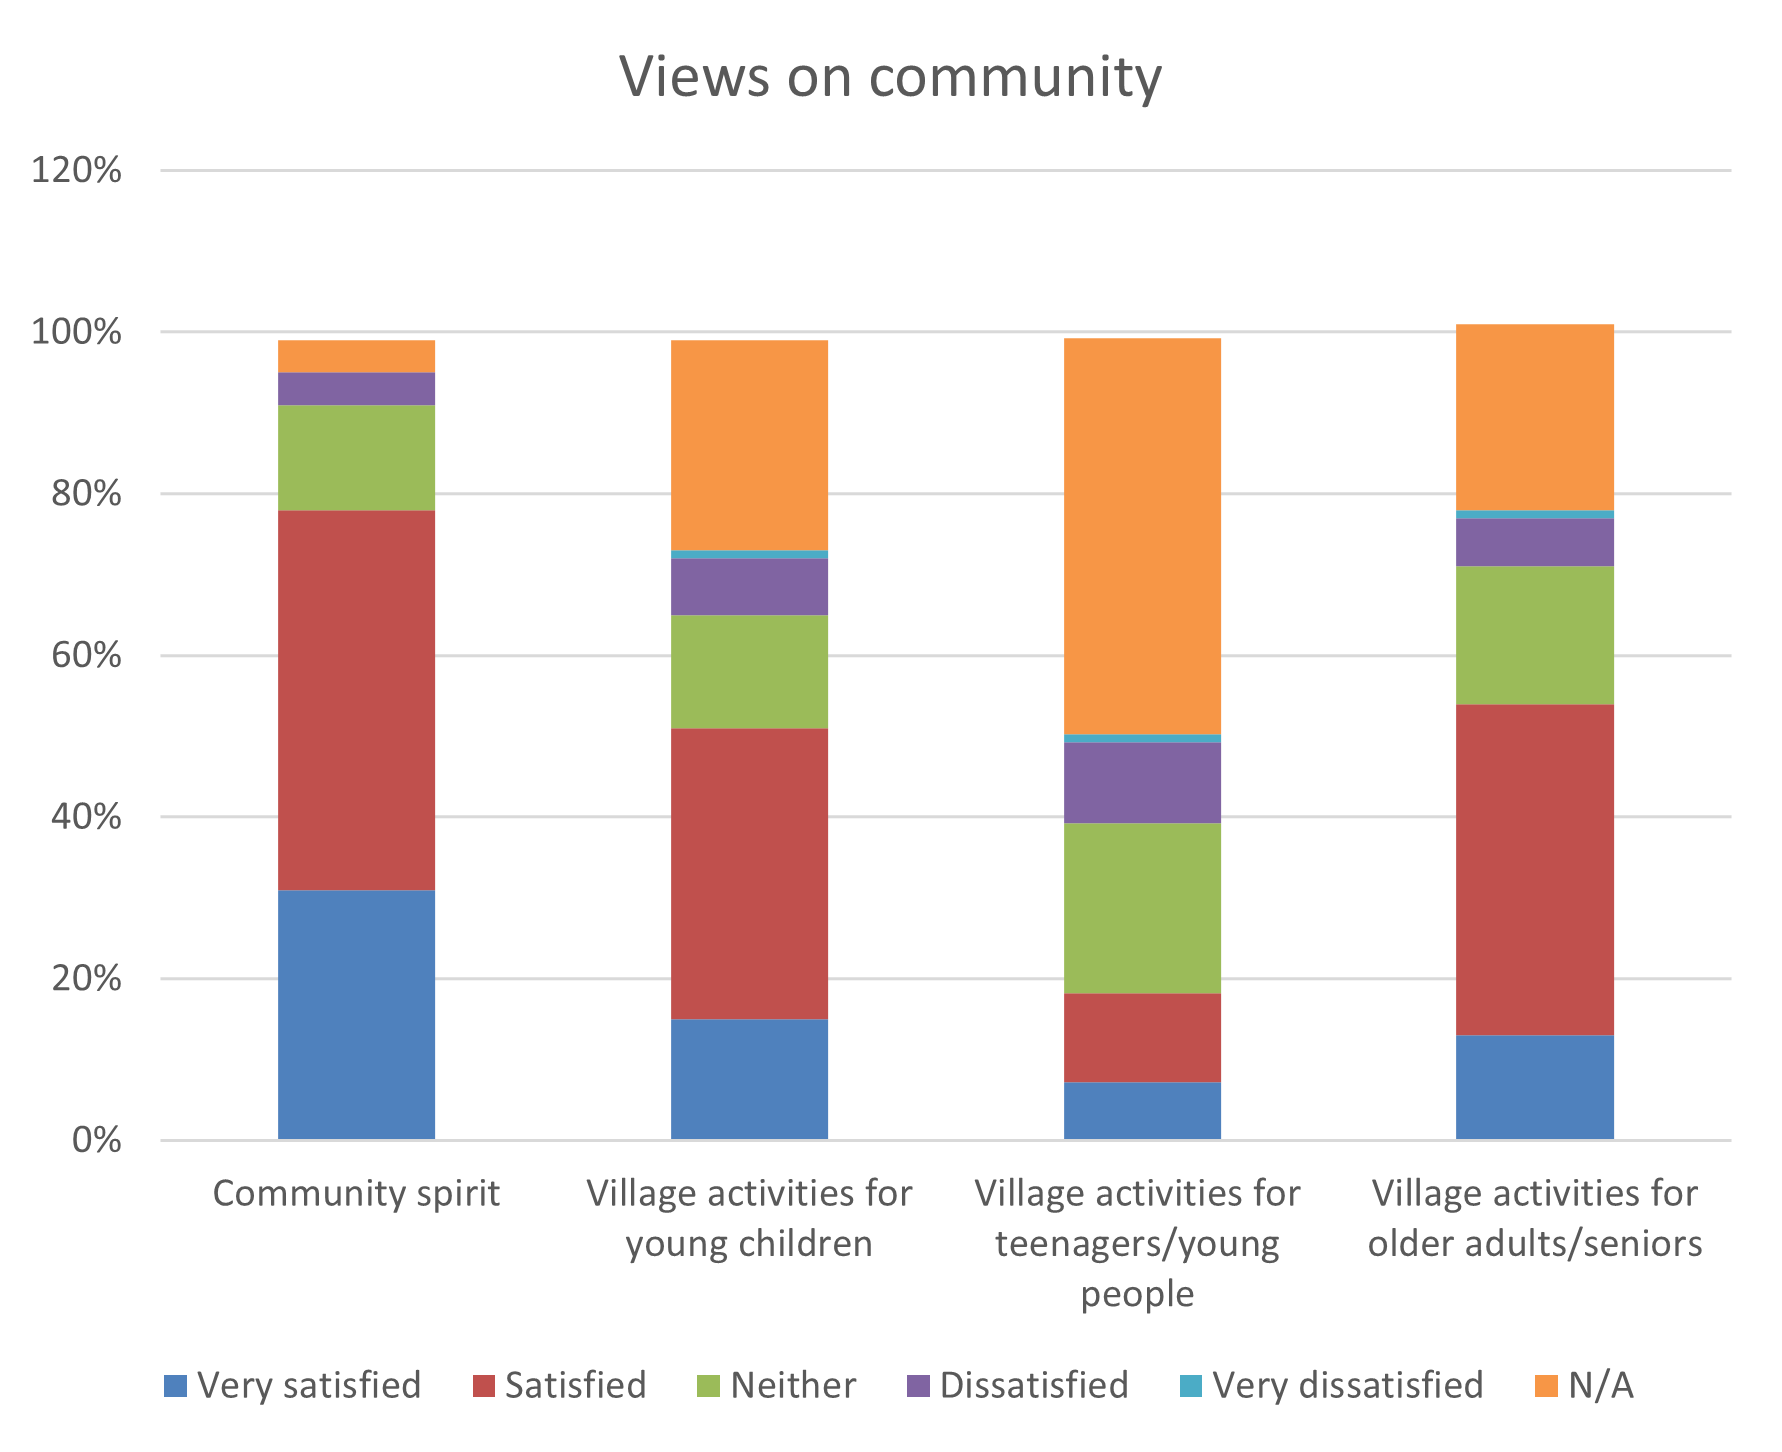
- There is a high level of satisfaction with community spirit in the village (+ve 78%).
- Of those who expressed an opinion, there is general satisfaction with activities for the young (+ve 70%*) and seniors (+ve 72%*).
- Satisfaction with activities for teenagers was more mixed but with few expressing opinion or providing a neutral opinion. No teenagers responded to the questionnaire so their views are missing.
Community Communications
-
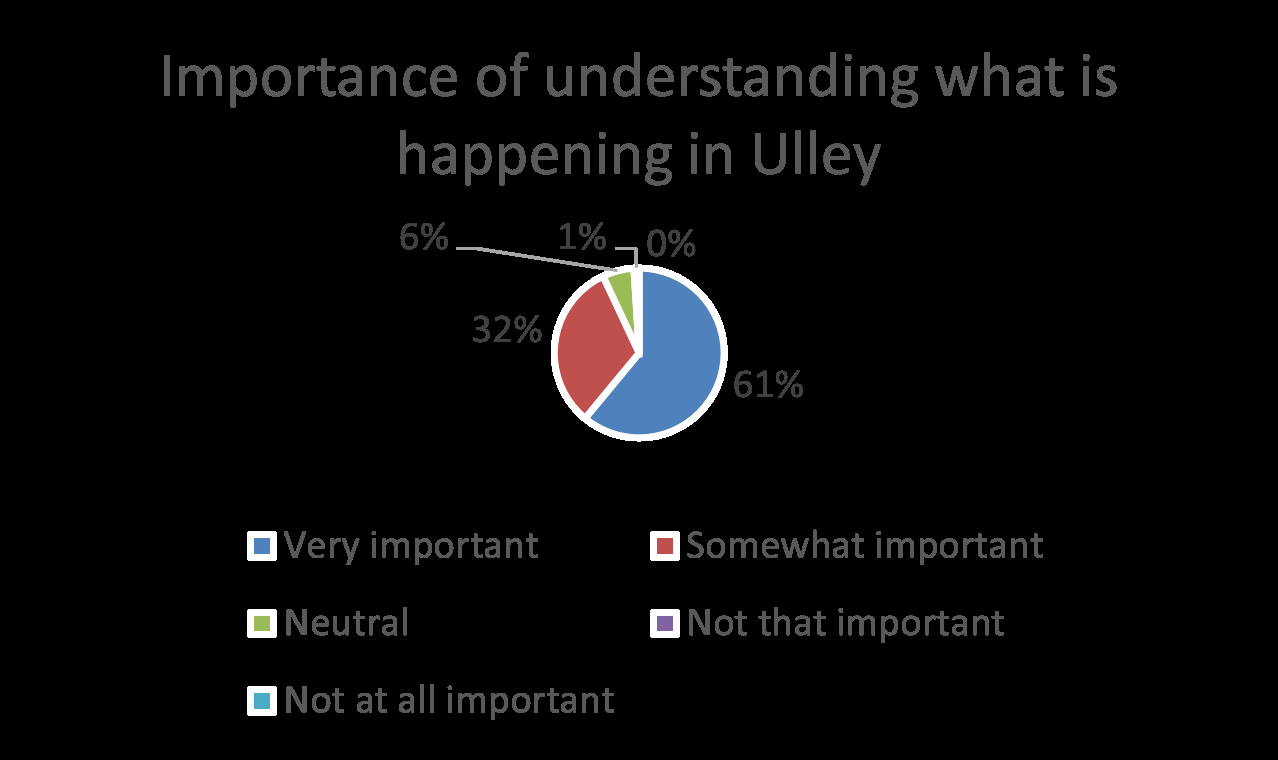
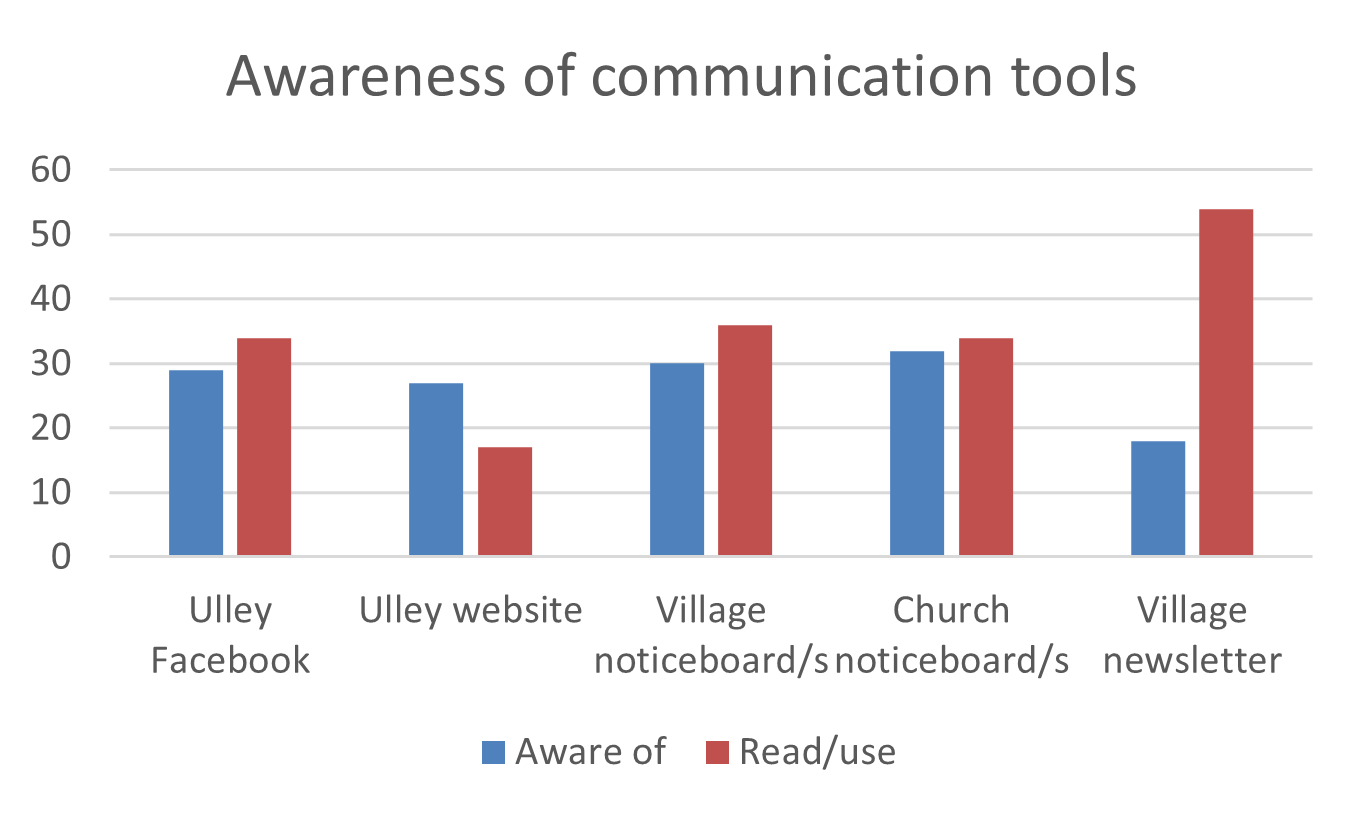
It is very important to 61% of respondents to be kept informed of what is happening in the village and somewhat important to a further 32%.
-
The village newsletter is the most read/used communication tool, followed by noticeboards and Ulley Facebook.
-
Few are aware of or have used the village website.
-
Suggestions for improving village communications included:
-
More information from the different groups in the newsletter
-
Clearer minutes from council meetings
-
Open village meetings
-
More information on noticeboards
-
Leaflets
-
Emails
-
Whatsapp groups
-
Advertise more events
-
Pub or a shop as a central point
Community Events
-
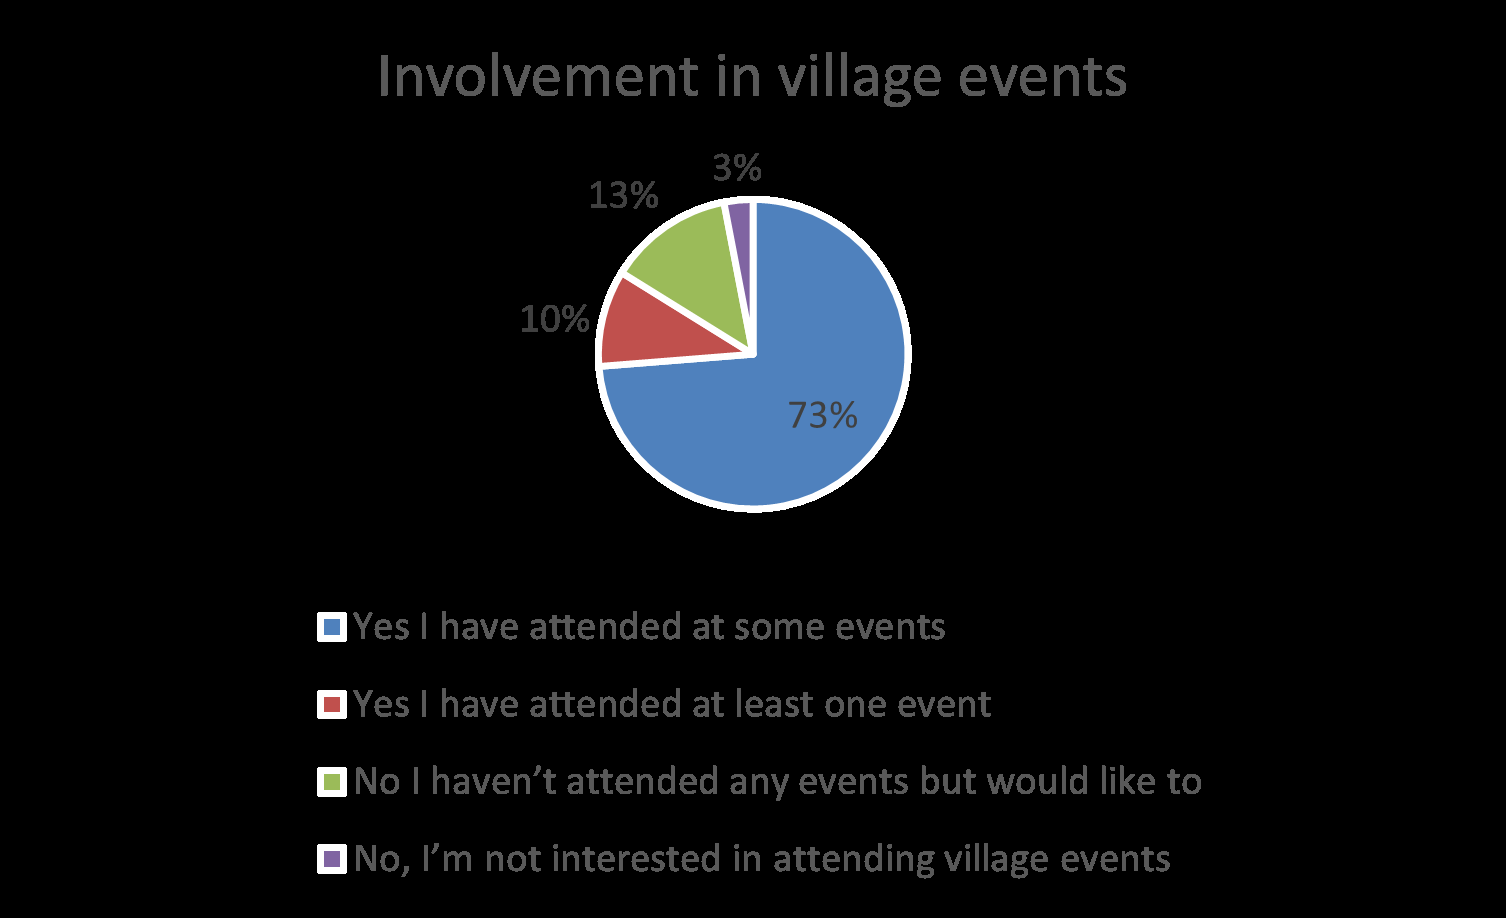
High proportions of respondents have or would consider attending village events.
-
41% have hired the village hall and around a half would consider hiring it in the future suggesting it is a useful and used resource.
| Have done | Would consider | Not interested | Not aware | |
| Hire the village hall | 41% | 51% | 4% | 4% |
| Attend private events in the village hall | 56% | 39% | 4% | 0% |
| Attend willage events in the village hall | 66% | 39% | 4% | 0% |
| Attend village events in the church | 58% | 30% | 12% | 0% |
-
More specifically, events that have been most popular so far include: the childrens’ Christmas activities, the over 60s Christmas lunch, and Halloween activities (51%* have attended each of these where applicable).
-
Also popular have been the family carol/nativity service (47%*) and church organised childrens’ events (46%*).
-
In terms of village events that respondents would consider in the future, most popular are: Summer fair (53%*), race night (48%*), gin nights (45%*), social nights (43%*), and Christmas wreath classes (40%*)
|
Have attended |
Would consider |
Not interested |
Not aware |
N/A | |
|
Halloween trick or treat |
40% |
17% | 19% | 3% | 21% |
|
Over 60’s Christmas lunch |
33% | 20% | 10% | 1% | 35% |
|
Children’s Christmas party |
32% | 21% | 9% | 1% | 37% |
|
Race night |
21% | 45% | 22% | 4% | 7% |
| Summer fair | 38% | 52% | 6% | 3% | 1% |
| Well dressing | 42% | 31% | 15% | 7% | 6% |
| Ulley Woollies | 14% | 23% | 37% | 8% | 18% |
| Christmas wreth classes | 12% | 36% | 39% | 4% | 9% |
|
Musical evenings at the Church such as brass band |
38% | 31% | 25% | 4% | 3% |
|
Lent Lunch |
23% | 19% | 49% | 4% | 6% |
|
Family carol/nativity service |
43% | 29% | 17% | 3% | 7% |
|
Church organised children and family activities |
38% | 22% | 20% | 4% | 17% |
|
Sunday morning services at church |
22% | 13% | 55% | 0% | 10% |
|
Evening services at church |
16% | 20% | 51% | 1% | 11% |
|
Social evenings |
40% | 41% | 11% | 4% | 4% |
| Gin nights | 29% | 43% | 20% | 3% | 6% |
- Movie nights (68%) and bonfire/fireworks are also popular events respondents would consider in the future.
- We also asked for suggestions and the following were offered up (number of mentions in brackets):
- Yoga (6)
- Family tree courses (1)
- Keep fit (4)
- Crafts (1)
- Organised walks (4)
- Open the pub (1)
- Pilates (3)
- Bingo (1)
- Kids socials (3)
- Karaoke (1)
- Christmas fair (3)
- Summer BBQ (1)
- Café/soup (2)
- Afternoon tea (1)
- Socials (2)
- Football events (1)
- Scarecrow festival (2)
- Bar/beer tent (1)
- Cooking classes (1)
- Rural business event (1)
- First aid course (1)
- Village competition (1)
| Have attended | Would consider | Not interested | |
| Barn dance | 44% | 35% | 21% |
| Bonfire, fireworks | 45% | 51% | 4% |
| Kids disco | 21% | 30% | 48% |
| Movie night | 1% | 68% | 30% |
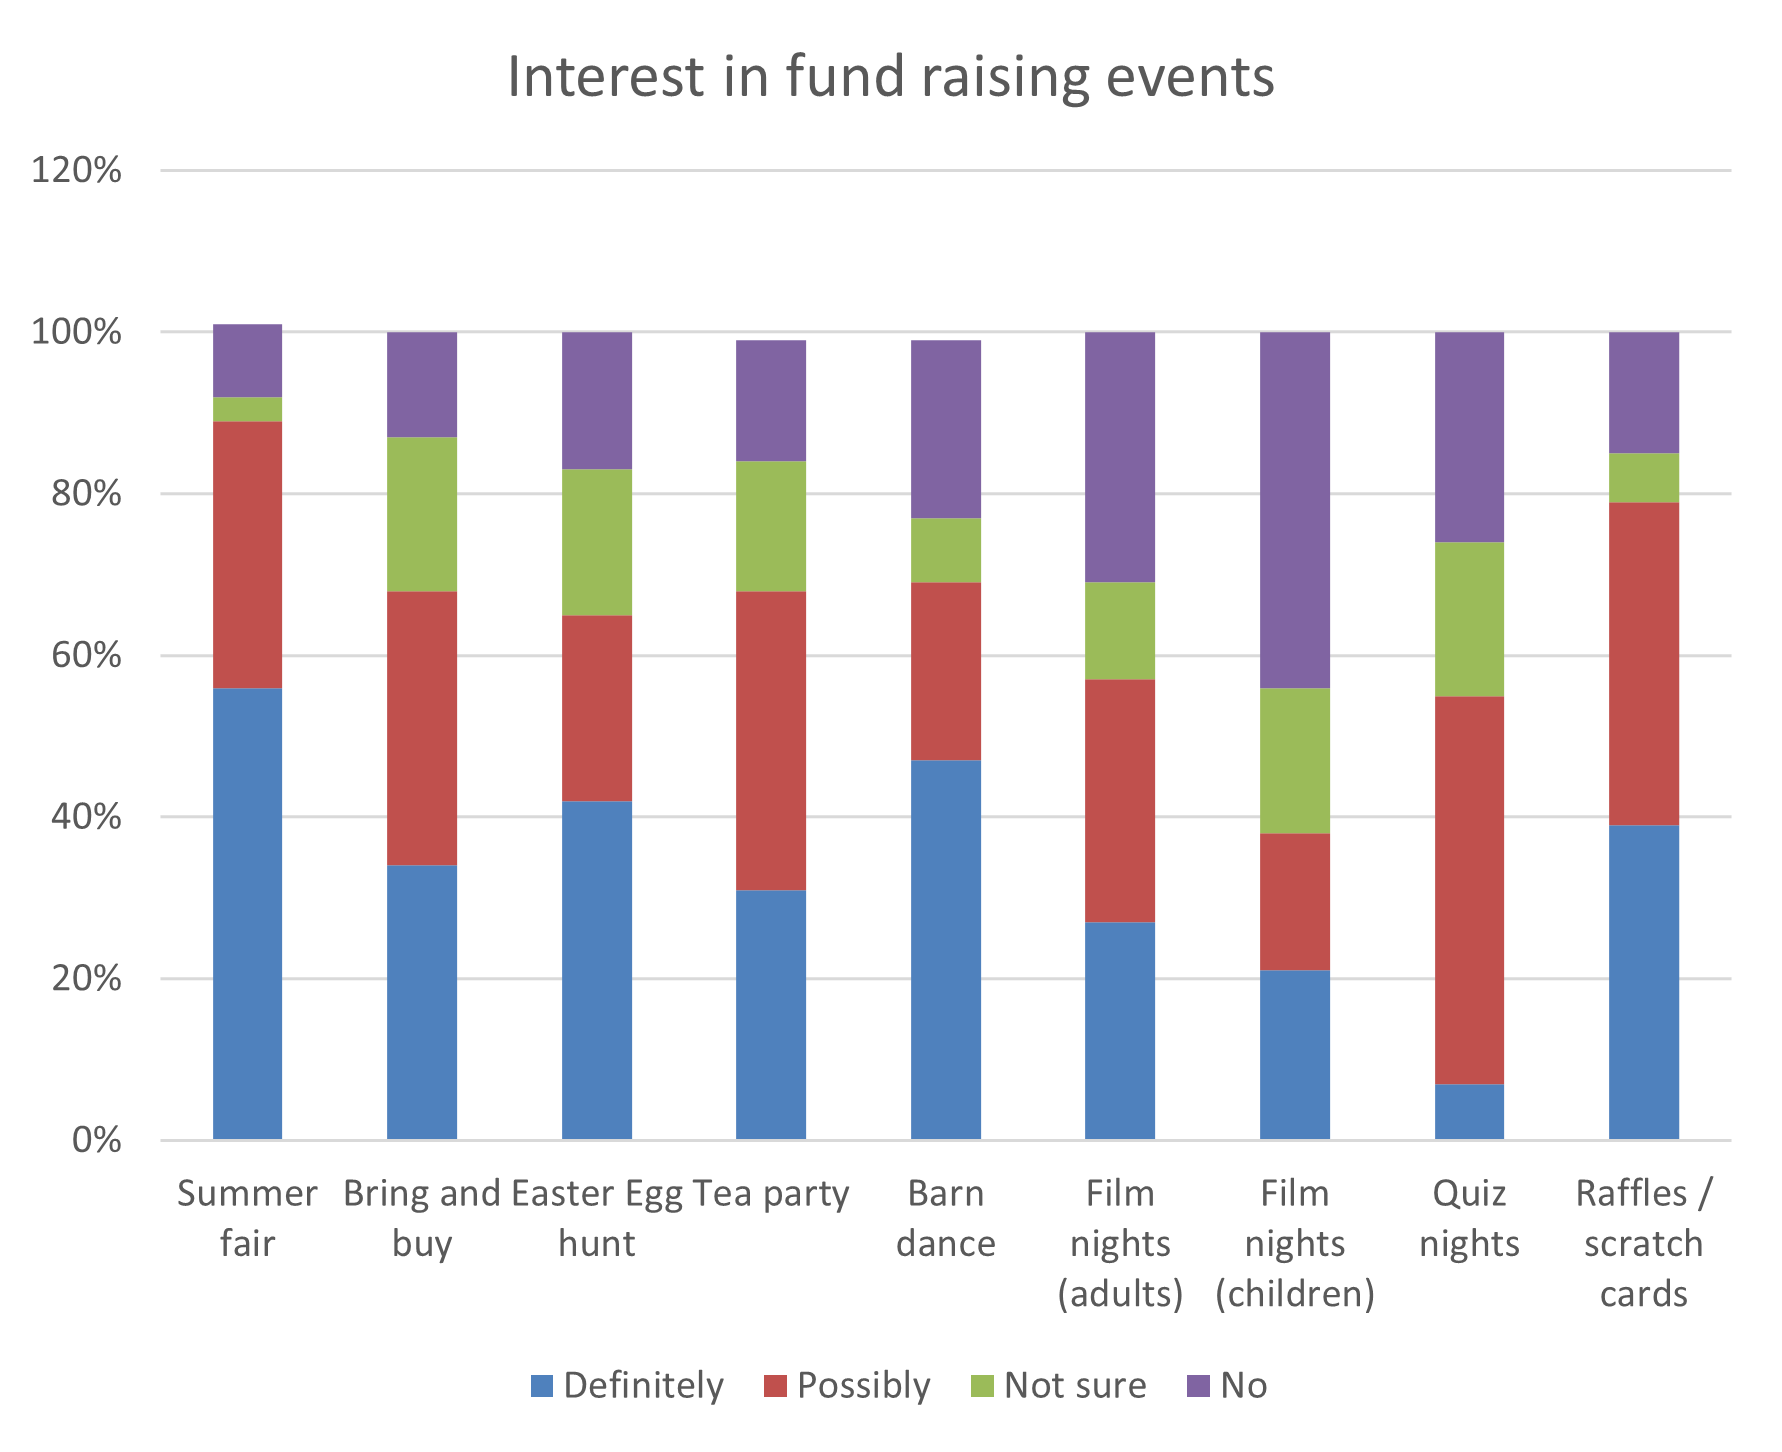
- We asked what respondents would support in terms of fund raising events.
- The most popular events (with definitely plus possibly answers) were:
- Summer fair (56% + 33% =89%)
- Barn dance (47% + 22% = 69%)
- Easter egg hunt (42% + 23% = 65%)
- Raffles/scratch cards (39% + 40% = 79%)
- Bring and buy (34% +34% = 68%)
- Tea party (31% + 37% = 68%)
- Other suggestions offered included:
- Sponsored walks (5)
- Jumble/yard sales (1)
- Fun run (1)
- Cake sales (1)
- Charity fundraisers (1)
- Football events (1)
Appearance
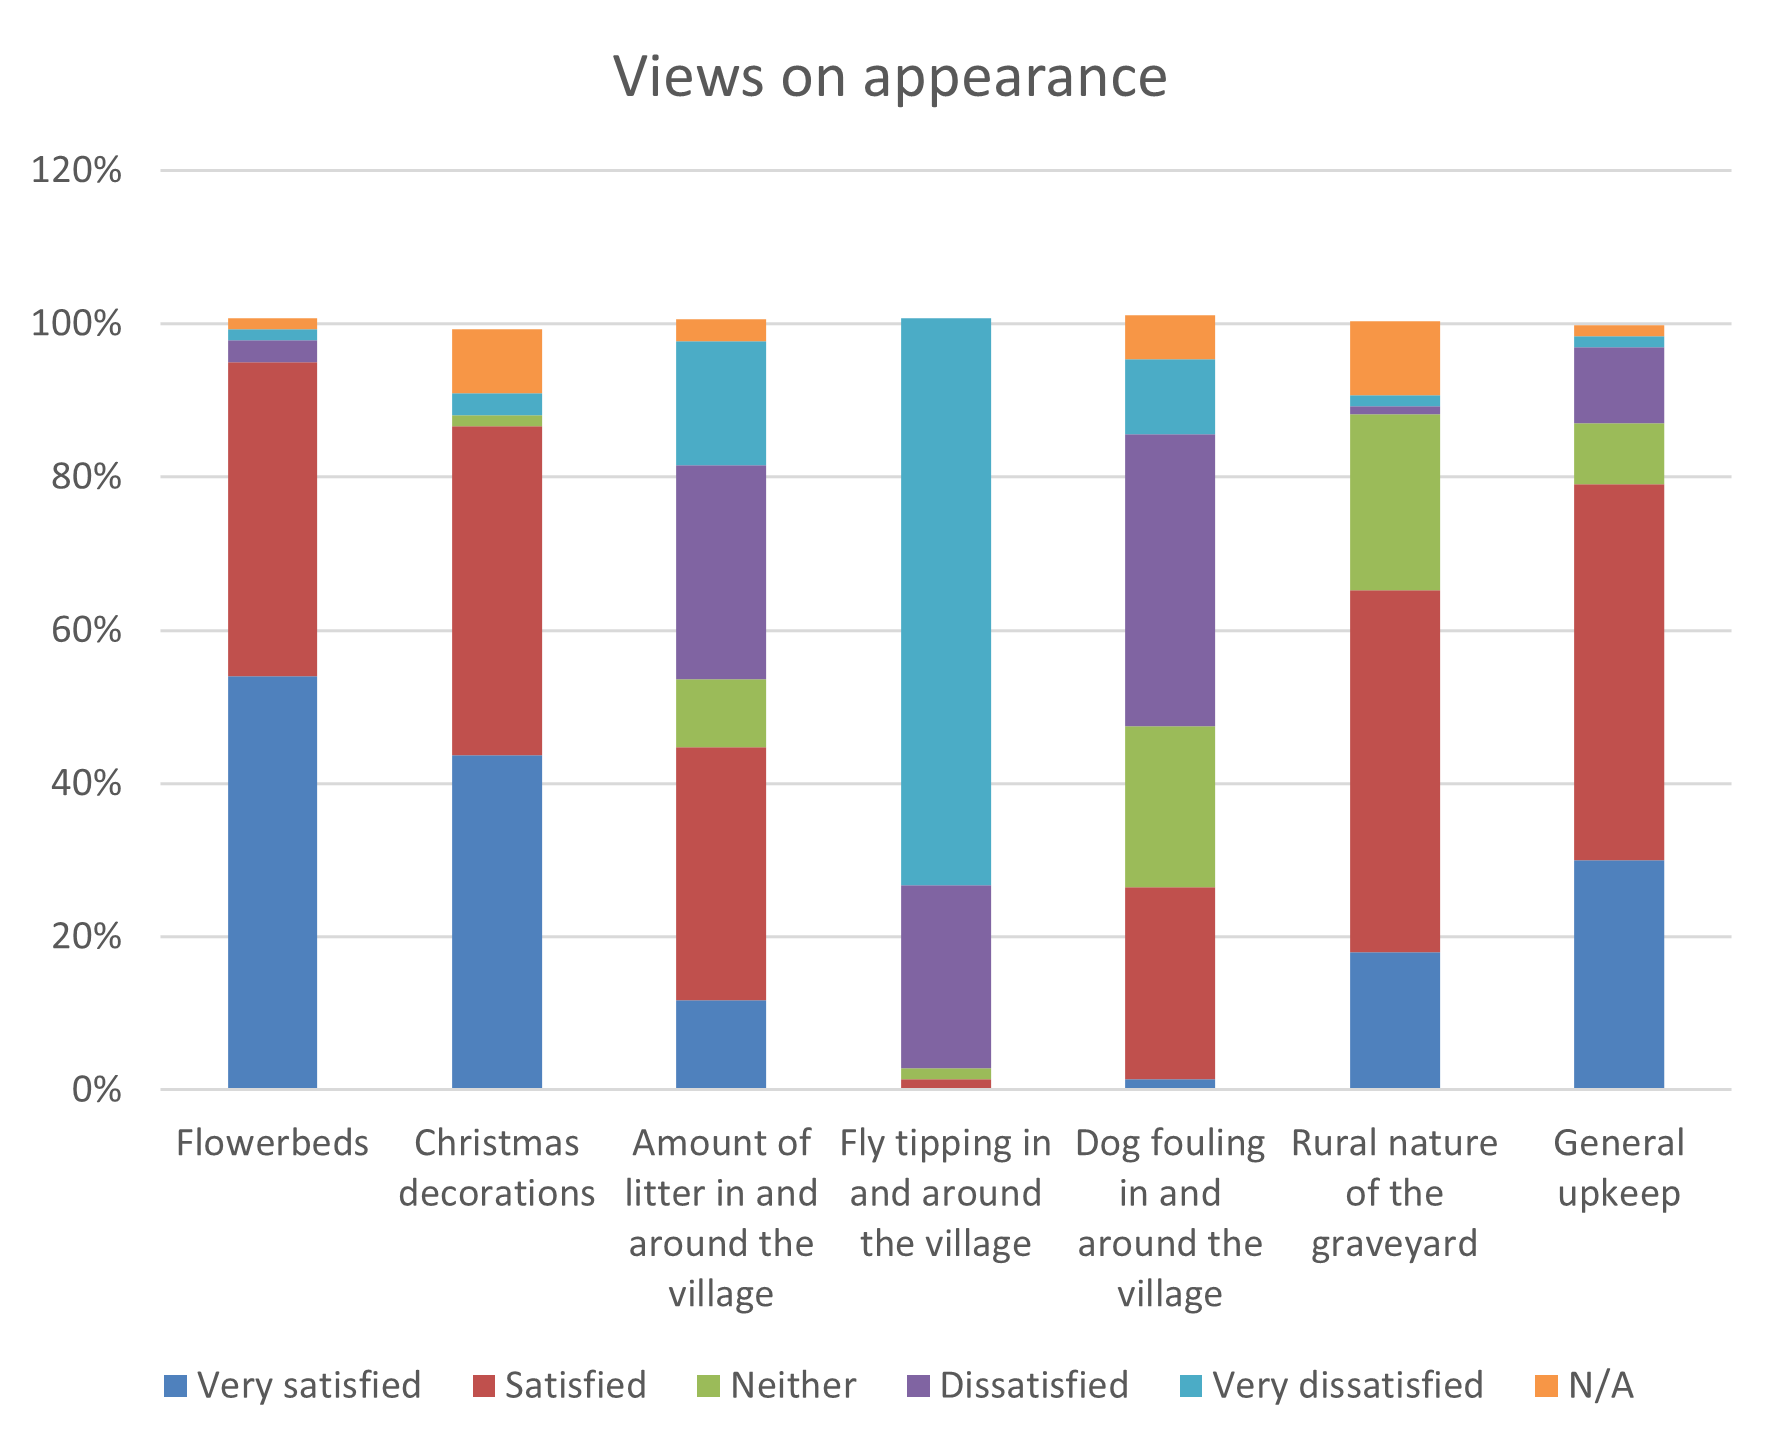
- There was high satisfaction with the general upkeep of the village with 79% satisfied or very satisfied.
- In particular there was appreciation for the flower beds (+ve 95%) and Christmas decorations (+ve 87%).
- The rural nature of the graveyard was generally appreciated with 65% satisfied (but with a large proportion neutral (23%) or unsure (10%).
- The areas where there was most dissatisfaction included:
- Fly-tipping in and around the village (-ve 98%)
- Dog fouling (-ve 48%)
- Amount of litter in and around the village (-ve 44%)
Village Environment
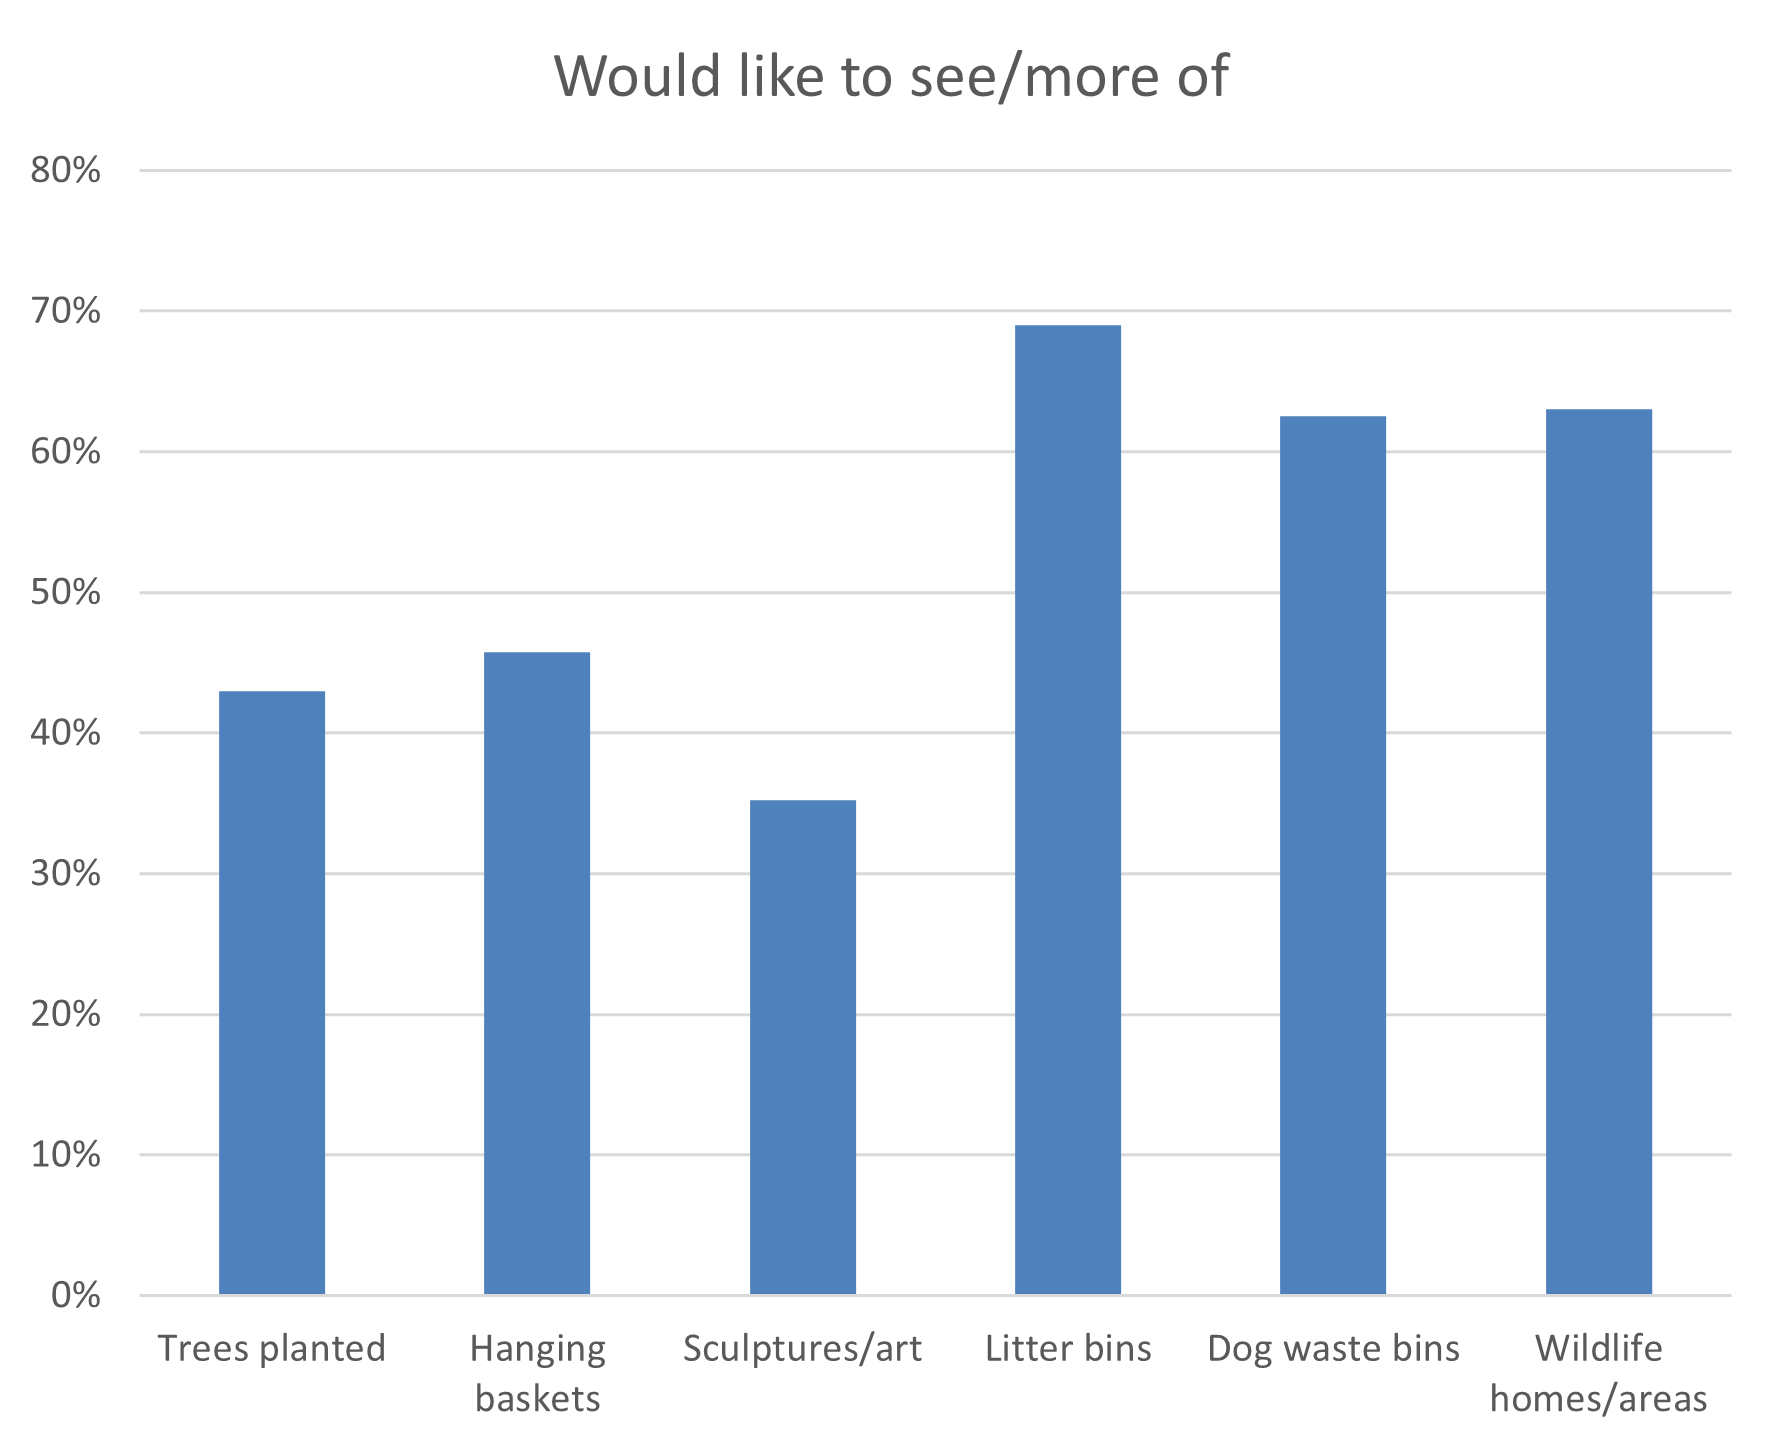
- We asked what people would like to see more of in the village. Litter bins came top with 69% of respondents wishing to see more.
- There was also a desire to see more dog litter bins and wildlife (63% each).
- The desire for trees, hanging baskets and sculptures/art received mixed views with just under half wishing to see more of these but similar proportions neutral.
- Additional suggestions were made by one or two respondents, including:
- Fixing existing litter bins
- Free range chickens
- Village shop
- Clarification of conservation area
- Less reliance on volunteers
- Visiting local businesses
- Quiet areas/areas for all ages
-
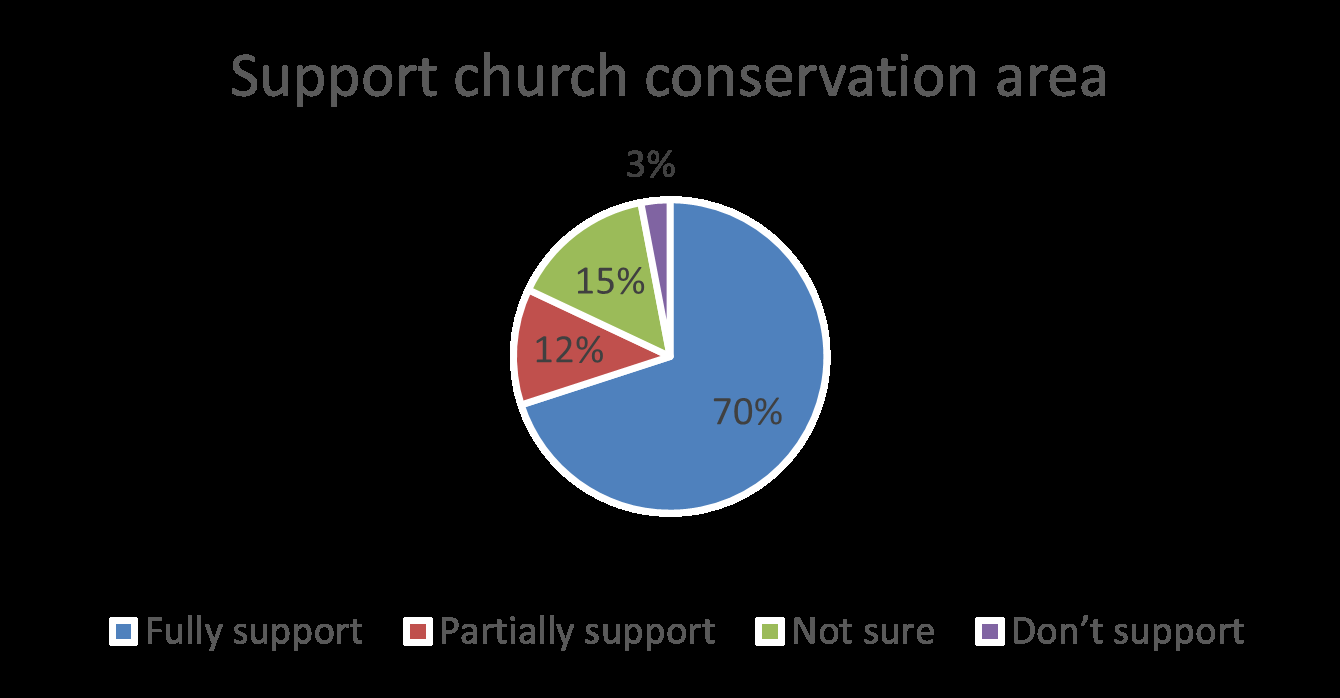
Respondents were supportive of the development of the quiet area behind the church (70% fully supportive plus 12% partially supportive)
-
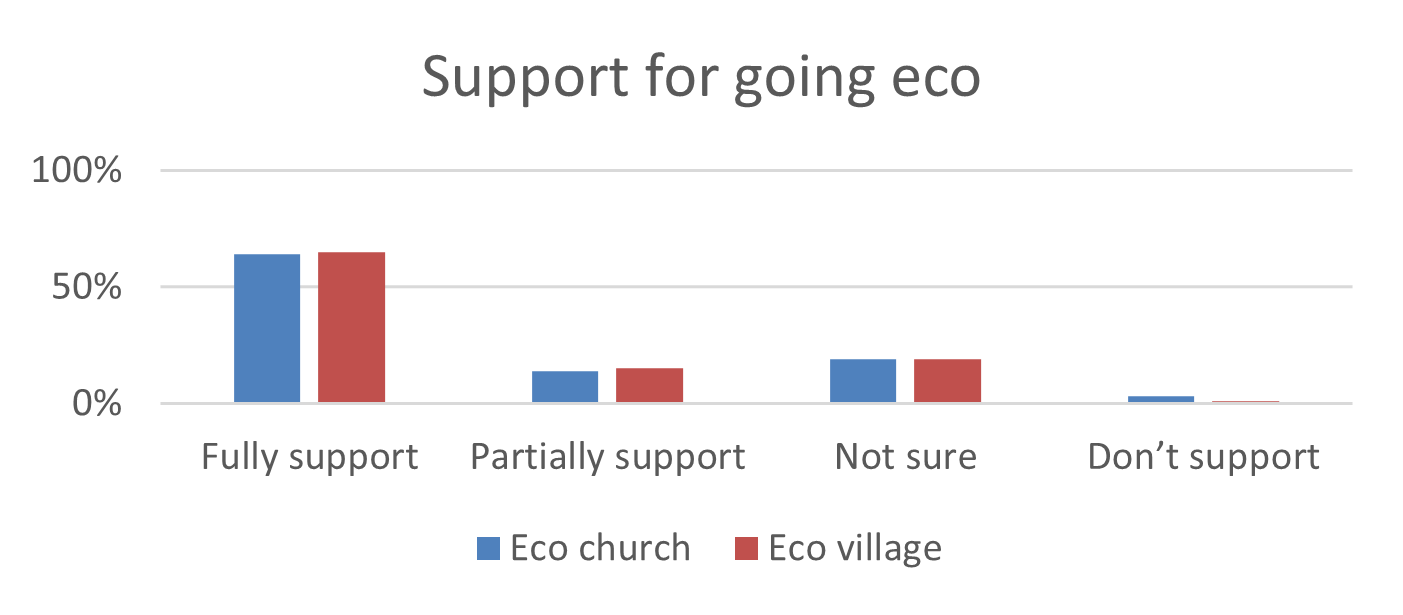
Over a half were fully supportive of the church becoming an eco church (64% fully and 14% partially supportive) and the village becoming an eco village (65% plus 15%)
-
In respect of the eco village suggestion, 19% would like to know more.
Transport
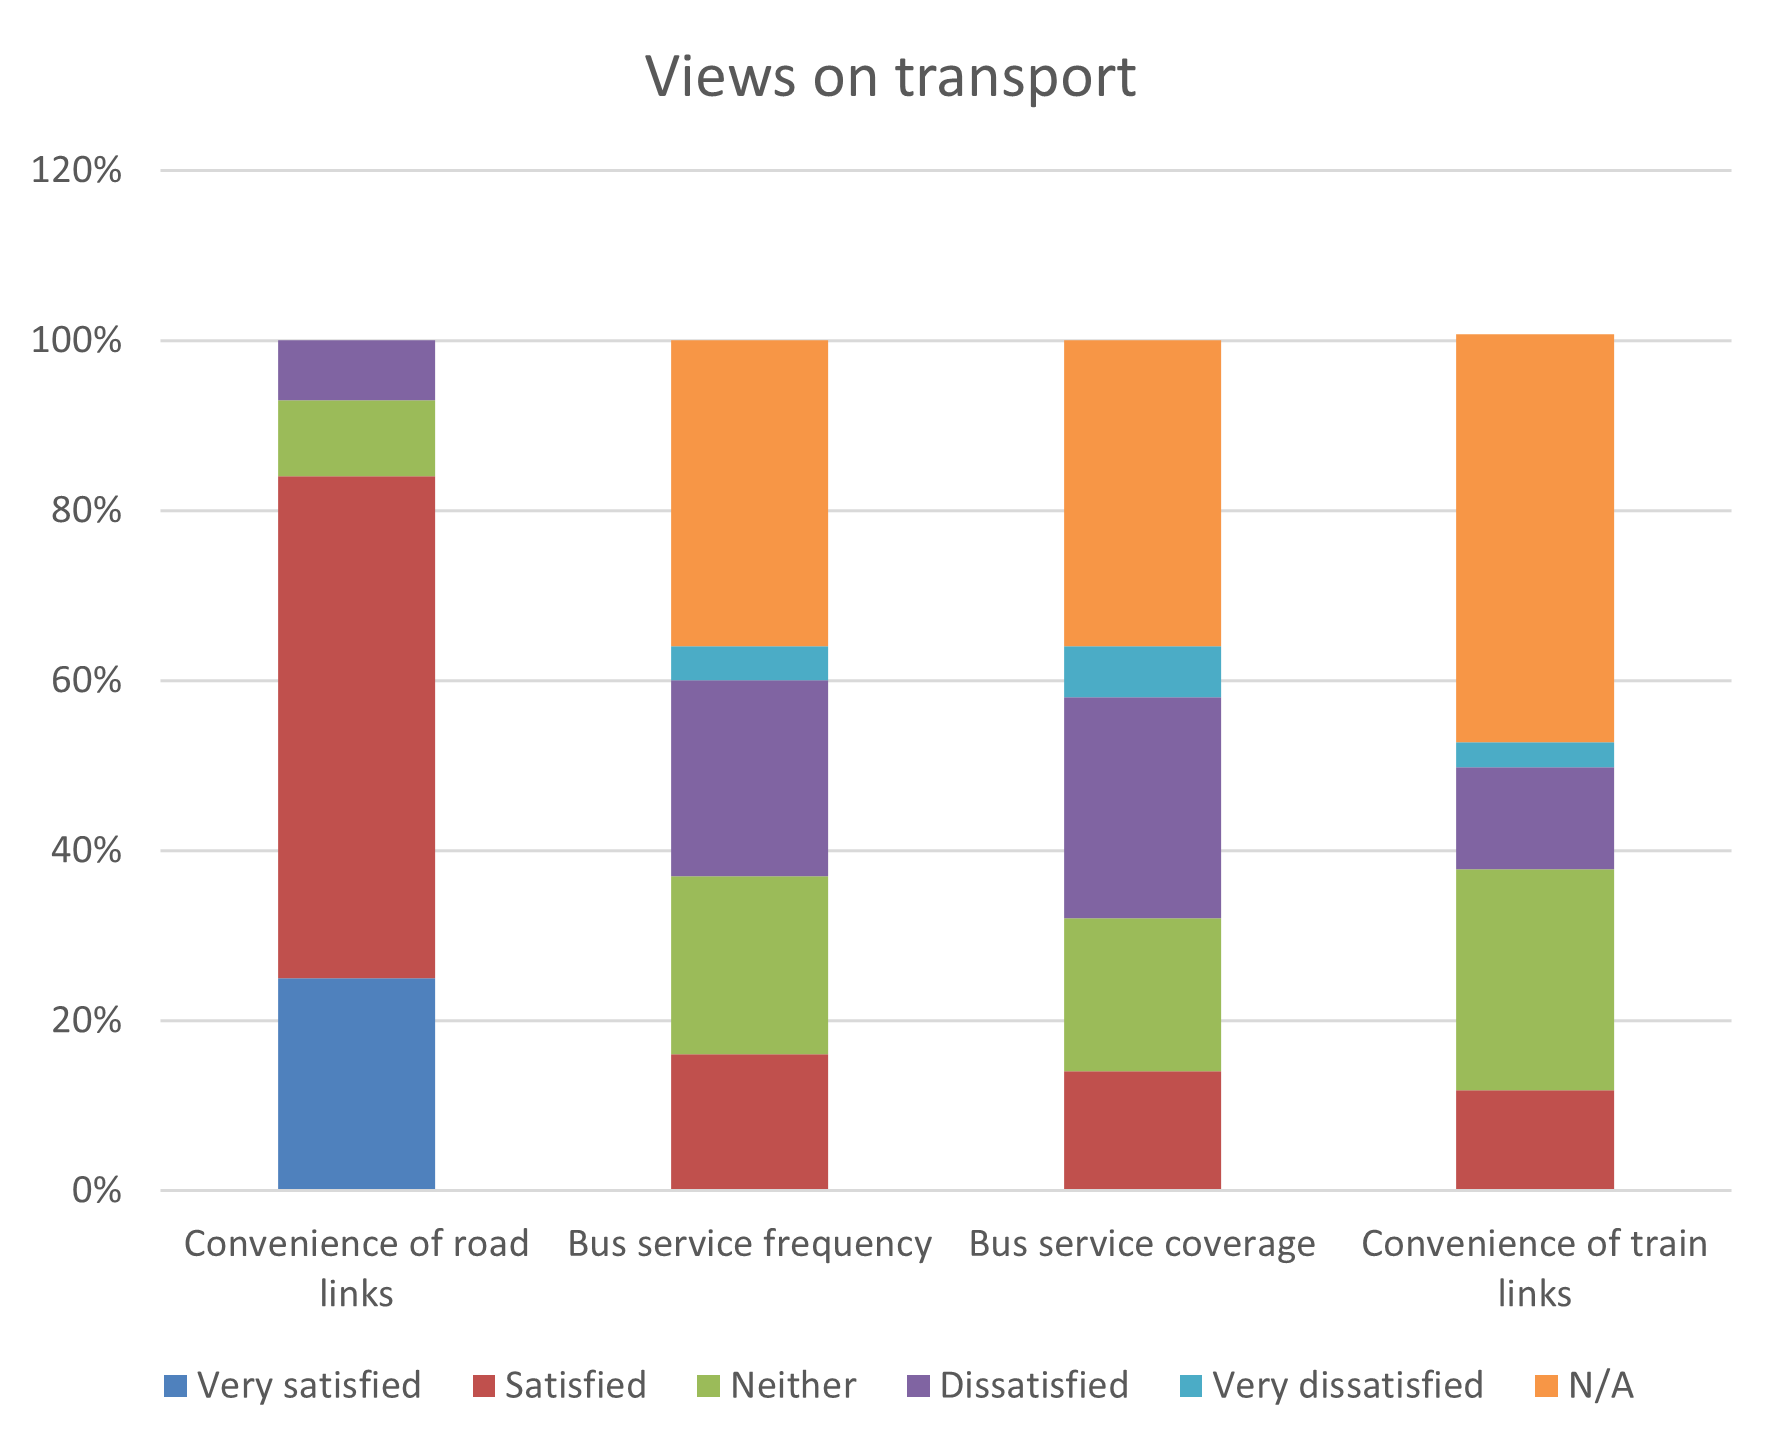
- Satisfaction with the convenience of road links is high (+ve 84%).
- But there is some dissatisfaction with bus service frequency (-ve 43%*) and coverage (-ve 50%*) amongst those who expressed an opinion.
- Only half of respondents had a view on train links, the majority were neutral and around 1 in 10 were either satisfied or dissatisfied.
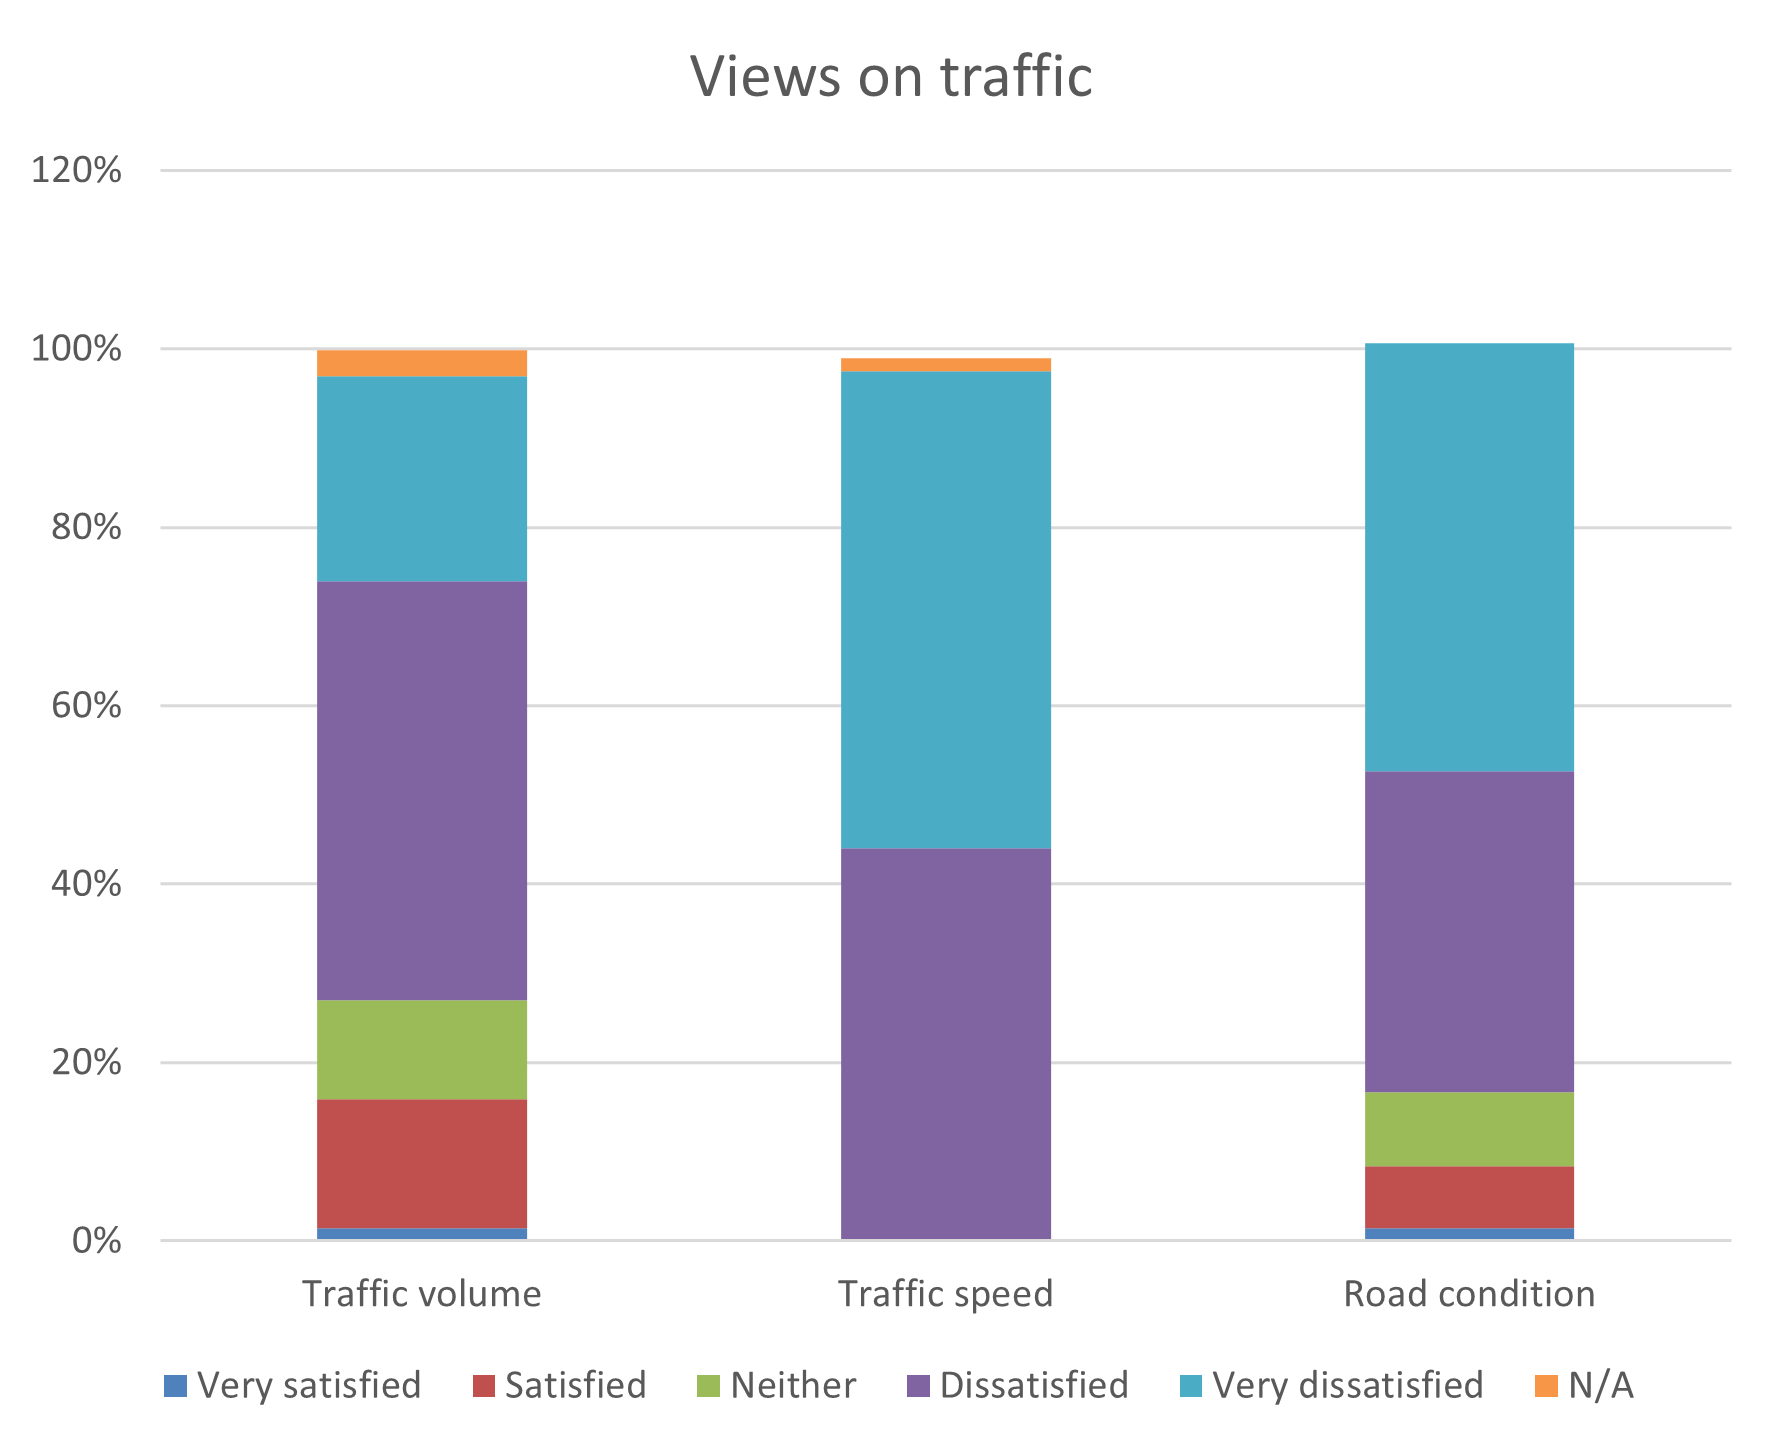
Traffic
- There are high levels of dissatisfaction with traffic across the board.
- Highest level of dissatisfaction is with traffic speed (-ve 98%)
- Road condition (-ve 84%) and traffic volume (-ve 70%) also see high levels of dissatisfaction.
- We asked what measures respondents would support to address their concerns. The majority were fully supportive of traffic calming bumps (75% fully supportive with a further 13% partially supportive) and a reduced speed limit (73% plus 11%).
- Over a half were fully supportive of yellow lines (plus 16% partially supportive).
- Road narrowing received mixed views with around half in favour and a half not.
- Other suggestions made by residents included: speed cameras, smiley face speed indicators, slow down signs, children playing/horses signs, cutting hedges, residents permits, fines, repair pot holes, and off road parking areas.
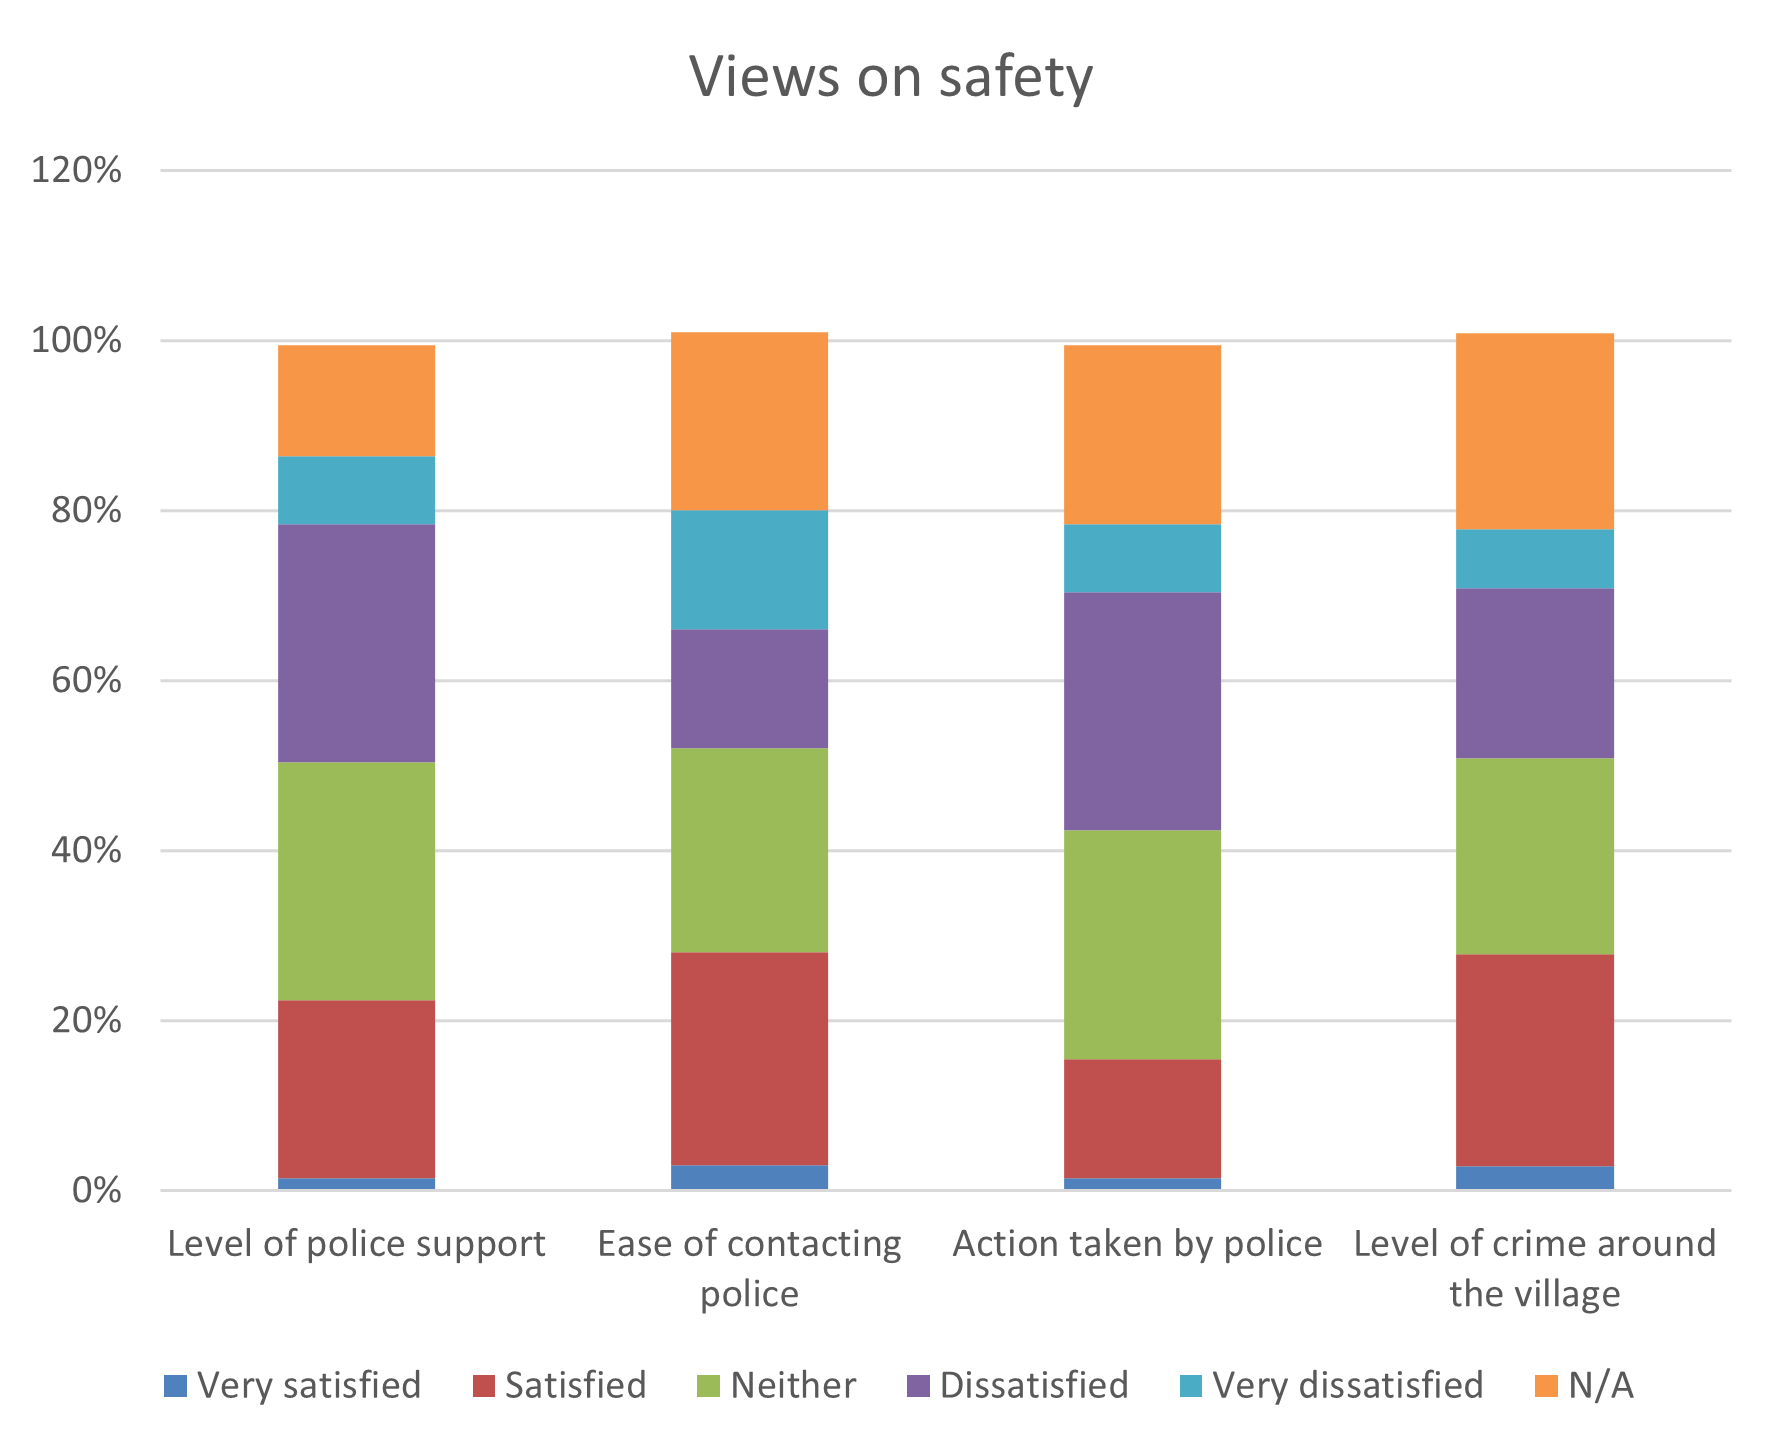
Safety
- There are mixed views on safety and in some cases not everyone offered a view.
- Around a third (-ve 35%*) of those who expressed an opinion were dissatisfied with the level of crime in and around the village. A further third (+ve 36%*) were satisfied.
- 42% of those expressing an opinion were dissatisfied with the level of support from the police, with just over a third (-ve 35%*) dissatisfied with the ease of contacting the police and a further 46%* dissatisfied with the action taken by the police.
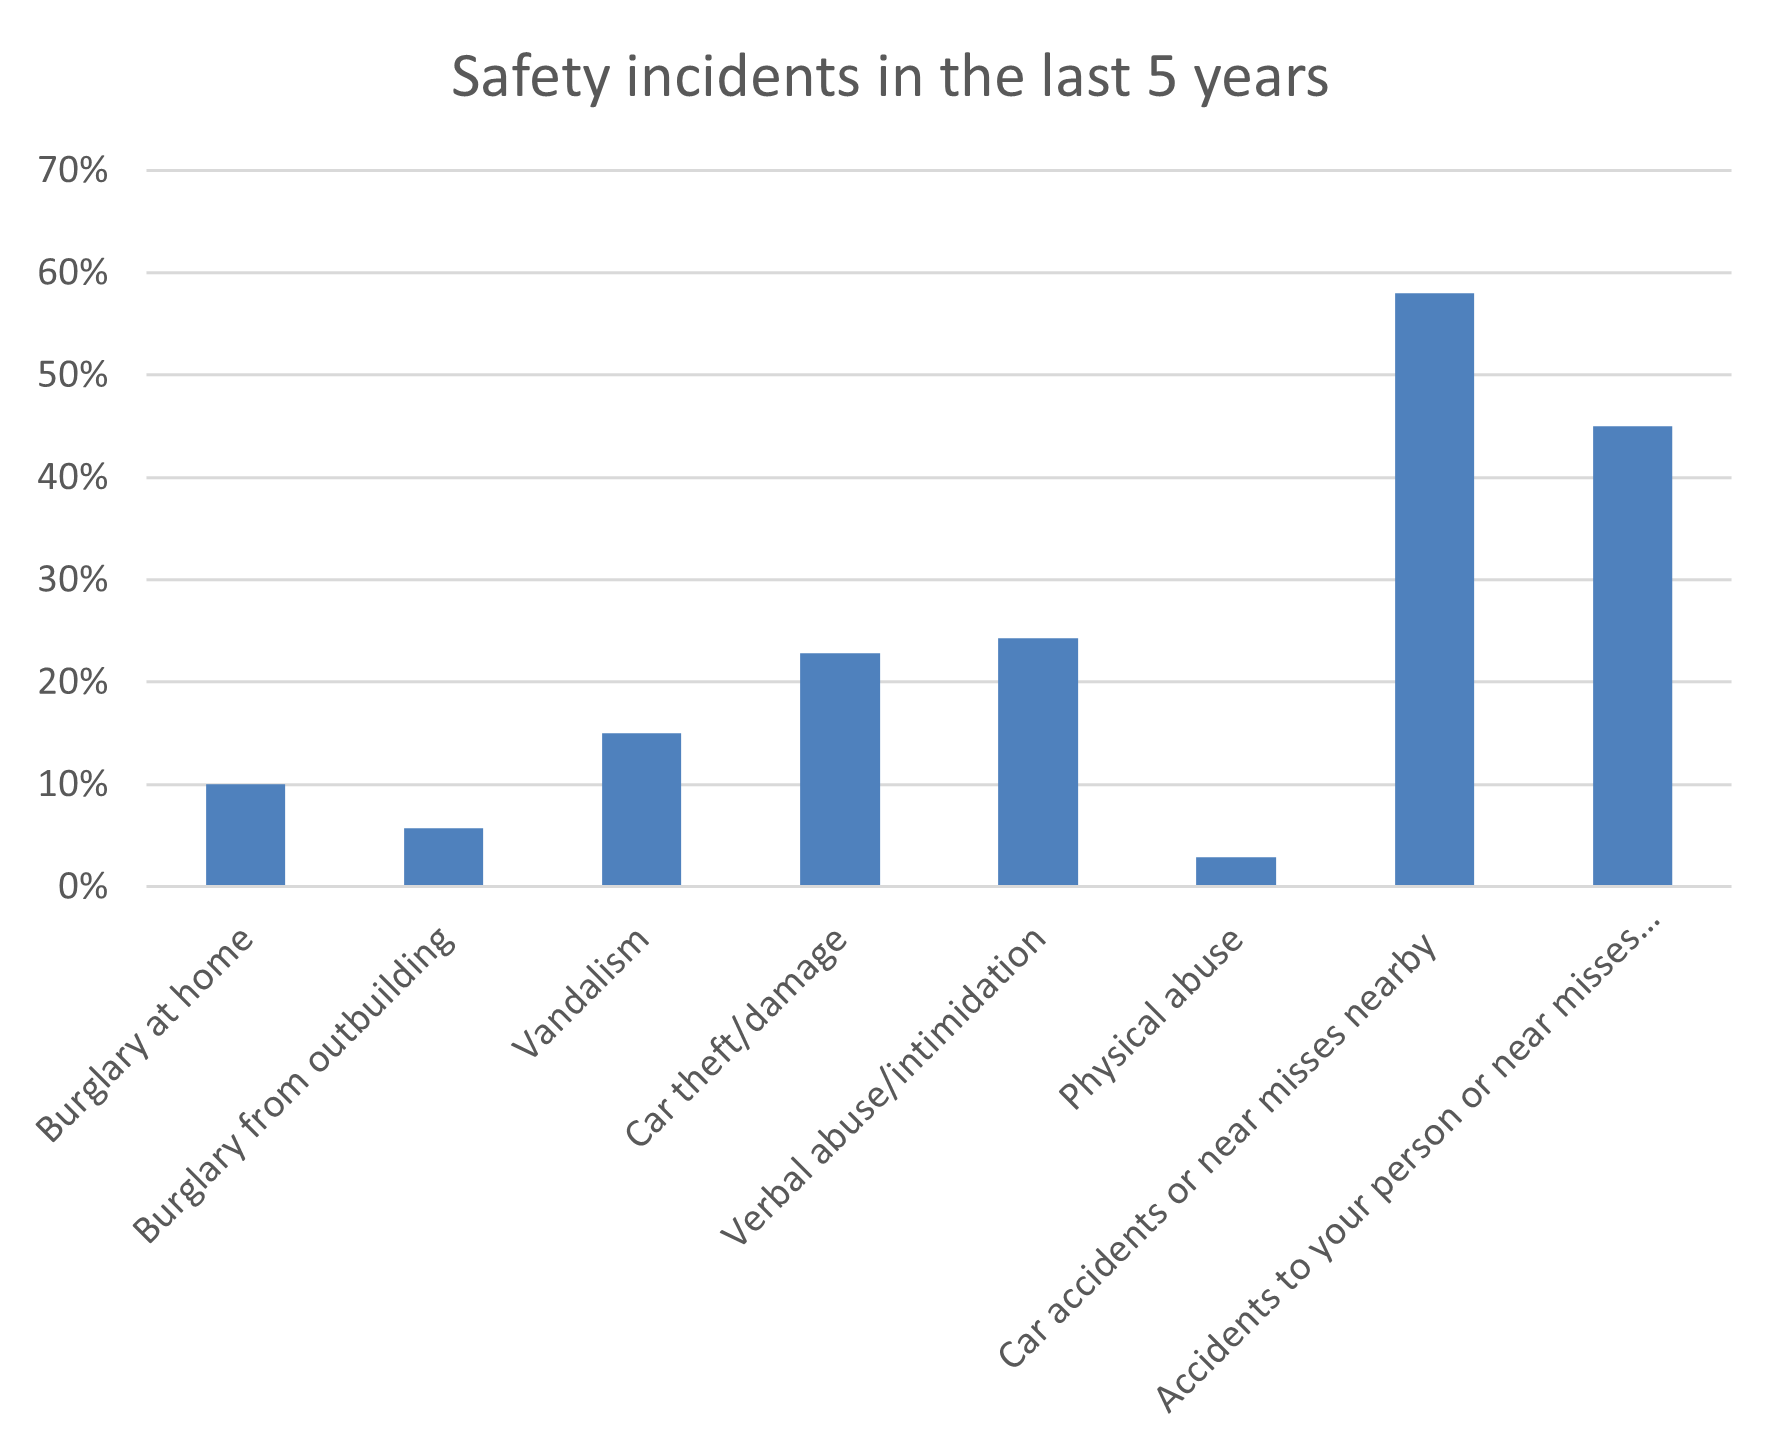
Safety and Crime]
- The most common safety related incident reported in the survey by respondents were car accidents or near misses (58%) and accidents or near misses to their person (45%) in or around the village.
- Car theft or damage and verbal intimidation or abuse are also high with around a quarter of respondents suffering these in the last 5 years (23% and 24% respectively).
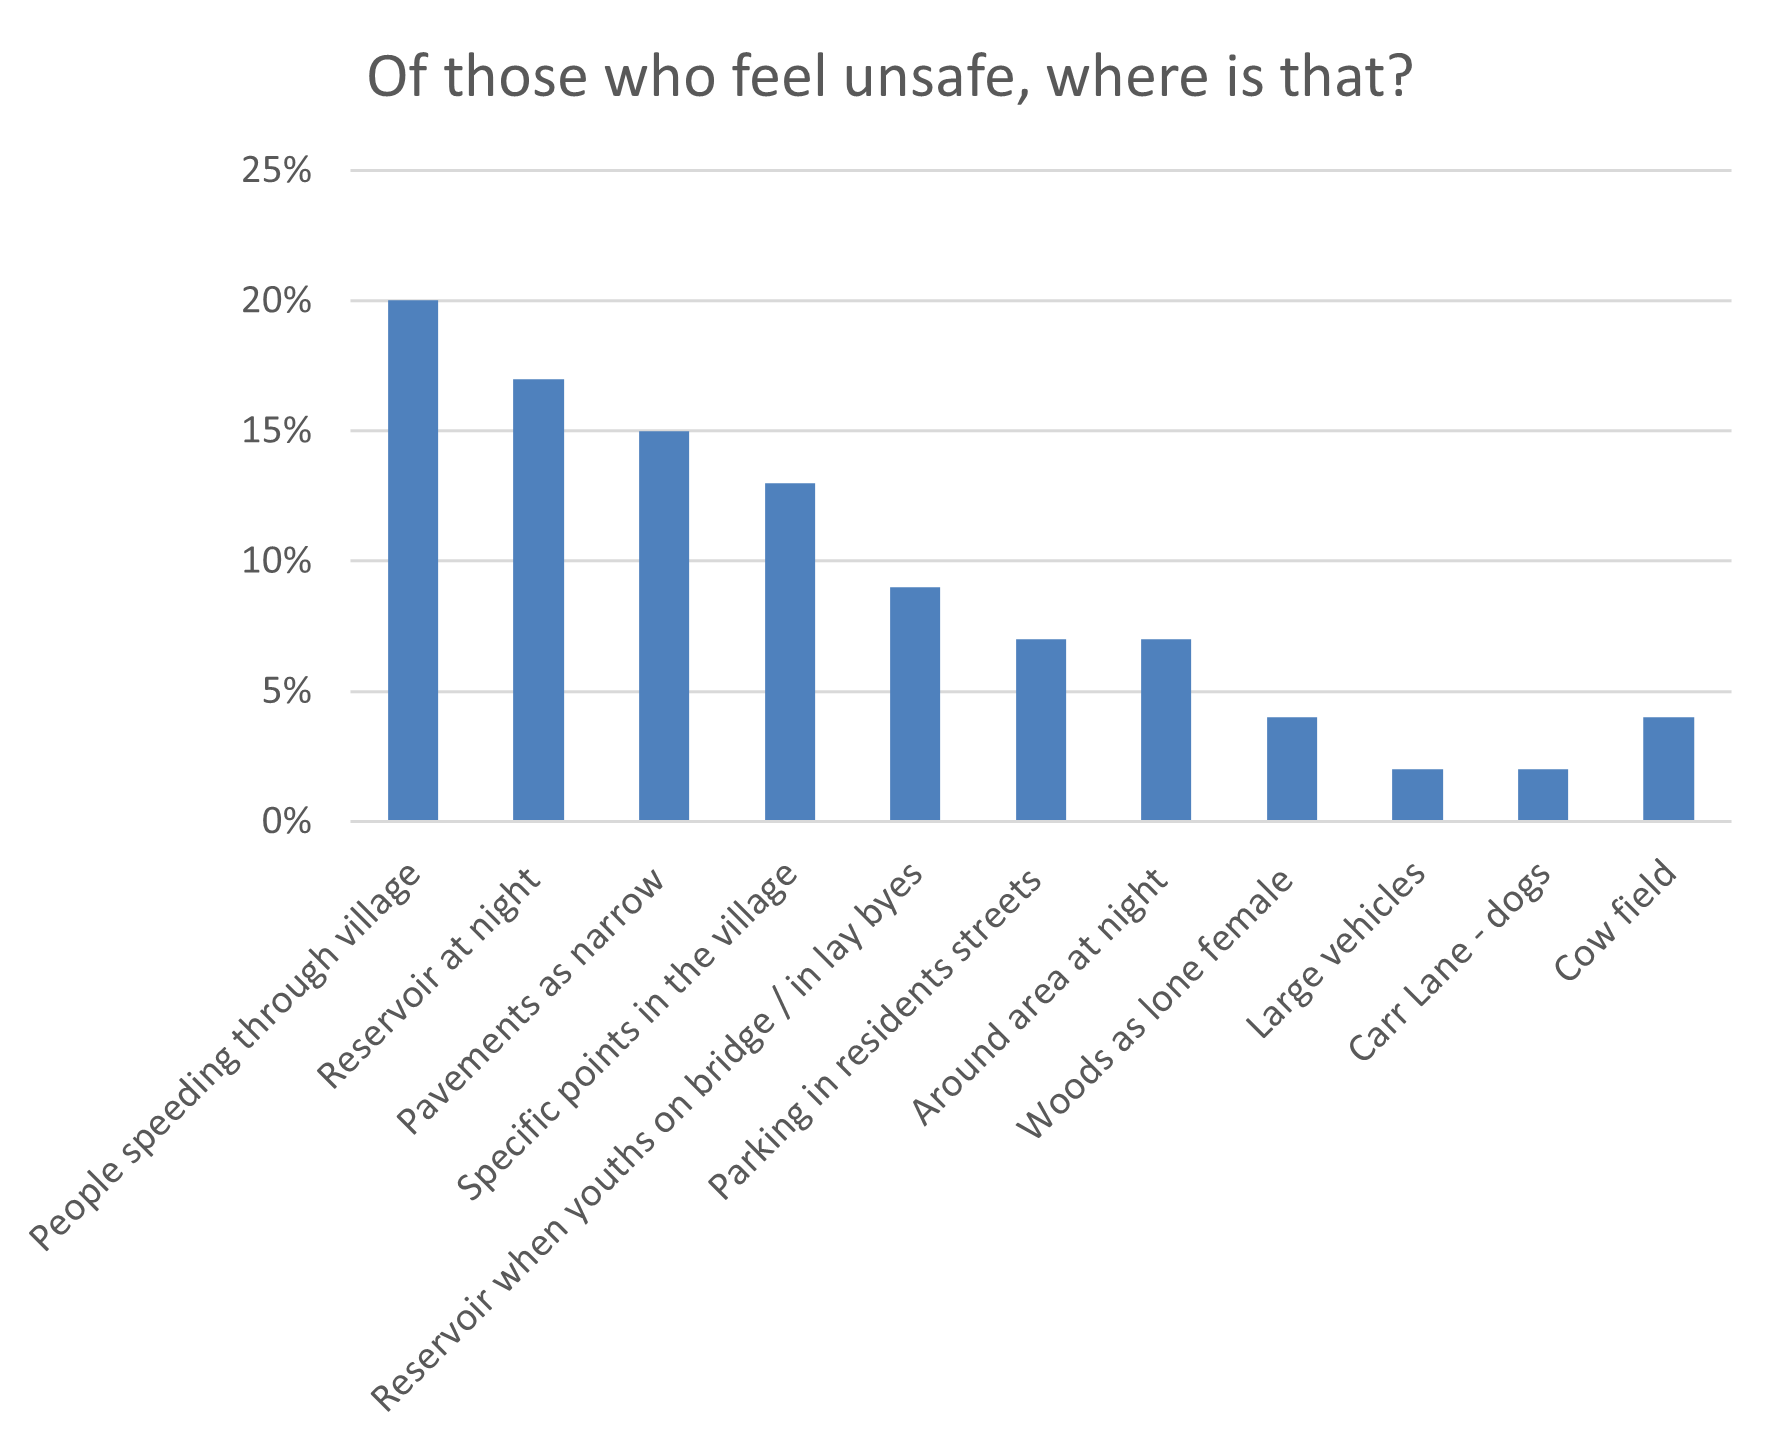
- Half of respondents felt unsafe in certain parts of the village.
- For the highest proportion, this is because of people speeding through the village (20%). Linked to this, 15% feel unsafe on the narrow pavements.
- The reservoir at night and specific points in the village also score 17% and 13% respectively.
Ranking the good and not so good elements of the village
- We asked respondents to rank the top 3 things they liked about the village and top 3 dislikes:
Likes:
- Community spirit 19%
- Local walks 12%
- Countryside 12%
Dislikes:
- Traffic speed 22%
- Fly tipping 20%
- Road condition 14%